Calculating The Value Of Overdue Invoices Using Many-To-Many Relationships in SSAS Multidimensional
Reposted from Chris Webb's blog with the author's permission.
Recently I had to solve the same, rather complex, problem for three different customers within the space of two weeks, a variation of the 'events-in-progress' problem I've blogged about a lot in the past. It's this one: how can you calculate the value of your overdue invoices on any given date? It's important to stress that we are not talking about the invoices that are overdue today - we want to be able to pick any date in the past and find out the value of invoices that were overdue at that point in time.
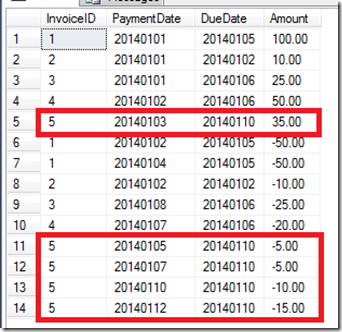
Let's imagine you have a fact table containing payments against invoices: each row has an invoice number, the date of the payment, the payment amount, and the date that the invoice is due. A positive value in the Amount column indicates that this is the opening amount of the invoice; negative values in the Amount column are payments against the invoice. Multiple payments can be made against an invoice before it is fully closed. Here's some example data:
Looking at the rows highlighted for invoice 5, you can see in the upper box that there is a positive amount of £35 shown on January 1st 2014 - this is the date that the invoice was opened, and £35 is the full value of the invoice. The invoice is due on January 10th 2014. In the lower box you can see there were four separate payments of £5, £5, £10 and £15 before the invoice was fully paid off on January 12th 2014.
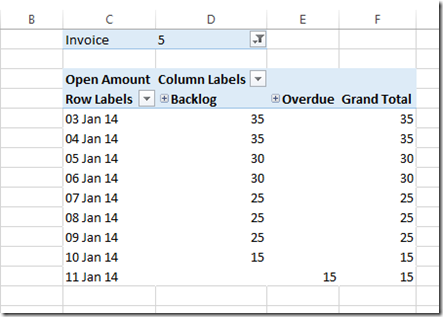
Now, if you were to do a total-to-date in MDX (similar to what I describe here) it would be pretty easy to calculate the outstanding amount on all invoices on any given date. However the requirement here is not only to do that, but to break the value down so that you can see what the total value for overdue invoices and non-overdue (which I'm going to call backlog in this post) invoices is on any given date. This is tricky to do because we have to take the Due Date of each invoice into account as well as the Payment Date. The desired output for invoice 5 is this:
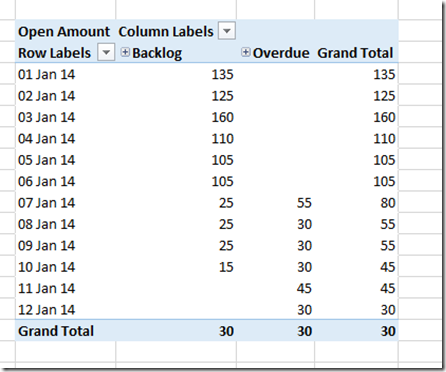
As you can see in this PivotTable, for invoice 5 £25 was still outstanding on January 9th 2014, but this is shown as backlog because this is before the due date of January 10th. On January 11th, one day after the due date, the remaining outstanding amount of £15 is shown as overdue. Of course, we also want to be able to calculate the correct values for all invoices:
One way of solving this problem would be to calculate the overdue and backlog values for each date that each invoice is open in your ETL, and store these values in a snapshot fact table. This works, and will give you the best possible query performance, but it has two major drawbacks: first, it makes your ETL much slower, and second it makes your fact table much larger. This post describes how you can calculate the overdue and non-overdue values on any given date using many-to-many relationships instead, without having to blow out the fact table.
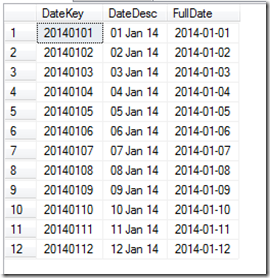
To go along with the fact table (called FactInvoice) shown above, I have a date dimension table called DimDate (I have deliberately reduced the number of rows here to the dates I have data for, for reasons that will become clear soon):
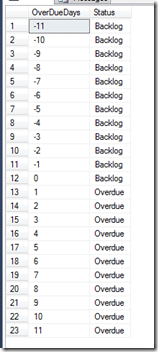
I have a dimension table containing all of the days that an invoice can be overdue or not overdue for (which has one less than double the number of rows as the date dimension table), plus a second column classifying each row as 'Backlog' or 'Overdue':
. and an invoice dimension table that just contains the distinct invoice numbers called DimInvoice.
Now, let me explain how to build the SSAS cube.
Step 1
- Build dimensions from all of the tables shown above, so you have dimensions called Date, Overdue Days and Invoice.
- Build a cube with one measure group, based on FactInvoice, and create one measure with AggregateFunction Sum based on the Amount column in that table.
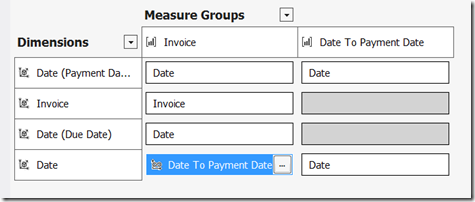
- Add the Invoice dimension to the cube with a regular relationship. Add the Date dimension to the cube twice, as Payment Date and Due Date, with regular relationships on the PaymentDate and DueDate columns. The Dimension Usage tab should look like this:
Step 2
- Create the following view in SQL Server:
- Add this view to the DSV and create a new measure group from it; you'll need to create a measure here, but it can just be a Count measure.
- Add the Date dimension to the cube once again, this time leaving the name as Date (you will now have three role-playing copies of the Date dimension in the cube).
- Set up regular relationships between the Date and Payment Date dimensions and the new measure group, then a many-to-many relationship between Date and the Invoice measure group. This means that when you query the cube by the Date dimension, the many-to-many relationship will mean you see the sum of all Amounts whose payment date is up to and including the date selected. The Dimension Usage tab will look like this:
CREATE VIEW [dbo].[FactDateToPaymentDate]
AS
SELECT a.DateKey, b.DateKey AS PaymentDateKey
FROM dbo.DimDate AS a INNER JOIN
dbo.DimDate AS b ON a.DateKey >= b.DateKey
This view returns all of the combinations of a given date and all dates up to and including the date.
Step 4
- Create another view in SQL Server with this definition:
- Add this view to the DSV and build another measure group from it, again with a single Count measure on it.
- Set up a regular relationship between this new measure group and the Due Date dimension.
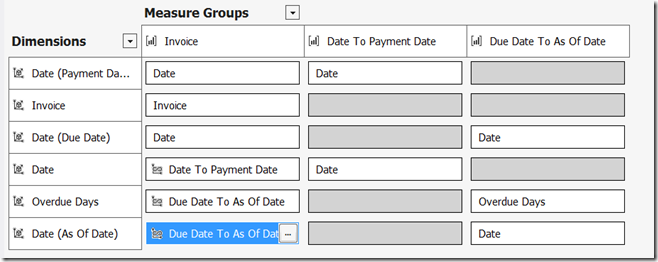
- Add the Overdue Days dimension to the cube, give it a regular relationship with the new measure group and a many-to-many relationship with the Invoice measure group through the new measure group.
- Add the Date dimension to the cube yet again, creating a new role-playing dimension called As Of Date, give it a regular relationship with the new measure group and a many-to-many relationship with the Invoice measure group through the new measure group. The Dimension Usage tab will now look like this:
CREATE VIEW [dbo].[FactDueDateToAsOfDate]
AS
SELECT a.DateKey AS DueDateKey, b.DateKey AS AsOfDateKey, DATEDIFF(dd, a.FullDate, b.FullDate) AS OverDueDays
FROM dbo.DimDate AS a CROSS JOIN
dbo.DimDate AS b
Yes, I am cross joining the DimDate table with itself and yes, this could return a lot of rows. However you should find that the view is very fast to execute.
The purpose of this measure group is this: if you select a date on the As Of Date dimension, you will be able to select 'Overdue' on the Overdue Days dimension and this will give you all of the dates on Due Date that were overdue on that date.
Step 5
- You only want to have to select one date in your PivotTable, so create the following MDX calculated measures that take your selection on the Date dimension and applies it to the As Of Date dimension too:
CREATE MEMBER CURRENTCUBE.MEASURES.[Open Amount Hidden] AS
([Measures].[Amount],
LINKMEMBER([Date].[Date].CURRENTMEMBER, [As Of Date].[Date])
), VISIBLE=FALSE;
CREATE MEMBER CURRENTCUBE.MEASURES.[Open Amount] AS
IIF(MEASURES.[Open Amount Hidden]=0, NULL, MEASURES.[Open Amount Hidden]);
- Hide all measures apart from the calculated measures you've just created
- Hide the Payment Date, Due Date and As Of Date dimensions
Conclusion
This is a very complex pattern, I know, and this is after I've simplified it a lot (if you need currency conversion as well then things get even worse) but I also know it's extremely useful from a business point of view. Query performance is also reasonably good, at least in the places where I have implemented this.
You can download my sample SQL Server database and VS 2012 project here.
 | Chris has been working with Microsoft BI tools since he started using beta 3 of OLAP Services back in the late 90s. Since then he has worked with Analysis Services in a number of roles (including three years spent with Microsoft Consulting Services) and he is now an independent consultant specialising in complex MDX, Analysis Services cube design and Analysis Services query performance problems. His company website can be found at http://www.crossjoin.co.uk and his blog can be found at http://cwebbbi.wordpress.com/ . |
Tags: mdx

