Configurable Running Totals in PowerPivot
Reposted from Jason Thomas blog with the author's permission.
Recently, I have been dealing a lot with business users and solving their problems. Even though I have been closely associated with the business in most of my previous projects, this project has given me a whole new perspective to the work I do. I am more used to the sort of work where I sit with the users, gather the requirements from them and then disappear to do my magic for at least a month. The users get to see the end result (and even the intermediate result in our scrum meetings) but they don't get to see me working (at least not every minute of the day). In contrast, here I sit with the users from morning till evening and solve their problems along with them. We tackle the problem as a team - the users armed with their business knowledge and me with the technical knowledge. The active involvement of the users can be mainly attributed to the PowerPivot / self-service BI drive, and the company is already reaping a lot of benefits from this. It is in midst of one of these meetings that I encountered an interesting requirement - the capability to change the order of running totals.
 Let me give a simplified version of the requirements below.
Available Data
We already have a PowerPivot file with the following tables:-
1) Product - has one column with Product names
2) CustomGroup - has one column with the CustomGroup names. Actually, this was a custom grouping of weeks like Late, Future, etc but for the purpose of this demo, we are just going to use values like G1, G2, etc. This is the field which is used for calculating the running totals, and the order in which the running totals should be calculated is specified in the Order column.
3) Stock - Will have the stock value for each Product.
4) Forecast - Will have the forecast quantity for a product and custom group.
You can download the source file (RT_Source.xlsx) from here. For the purpose of this post, the source data for these tables are sourced from linked tables in the file.
Requirement
- Running totals of the forecast should be calculated across the CustomGroup dimension. The order in which the running totals are calculated should be easily configurable, as the order can be different for different users.
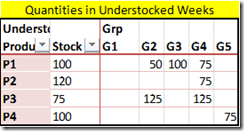
- A report should be generated which shows the stock for each product as well as the forecast across the custom groups. However, the forecast should only be displayed if the stock would not be sufficient for it. For eg, consider the image below where the first table shows the actual data. The second table shows how the end result should look like. For P1, the forecast quantity in G1 is not displayed as it can be covered by the stock. However, from G2 onwards, all the quantities are displayed for P1. Similarly for P2, the forecast quantity for G3 is not displayed as it is less than the stock. However, for G4, only 5 is displayed as you have 125 as the forecast for G3 and G4 and you just have 120 as stock .
Implementation
The final PowerPivot report (RT.xlsx) can be downloaded from here. For implementing this from the source file, follow the steps below:-
1) I need to display Stock along with Product in the rows of the report. For that, I am going to use the product column from the Product table instead of the fact so that it filters both the stock and forecast tables. To avoid the cross join of Product[Product] and Stock[stock] columns, I am introducing Stock as a calculated column in the Product table with the formula below:-
=CALCULATE(sum(Stock[Stock]))
2) The running totals need to be done across the CustomGrp values, and hence make sure that the order column specifies the correct order in which they should be performed.
The order can be easily changed from the source sheet in excel (from where this linked table is made) in case the running total needs to be configured for other users.
3) In the forecast table, make a calculated column which will get the corresponding order for the CustomGrp for that row using the formula below
=RELATED(CustomGrp[Order])
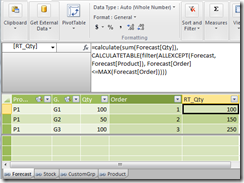
4) Once we get the Order for that row, the running total can be made as a calculated column using the formula below
=Calculate (
Sum ( Forecast[Qty] ),
CalculateTable (
Filter (
AllExcept ( Forecast, Forecast[Product] ),
Forecast[Order] <= Max ( Forecast[Order] )
)
)
)
This formula gets evaluated for each row, and then filters out all the rows for that particular product where the Orders are less than the Order value in the current row. Then it calculates the sum of forecast quantity for the resultant filtered table, and this gets us our running total.
The running total can also be made as a measure (I have created a measure called Test in the RT.xlsx for this) but I chose to implement it as a calculated column so that the running totals are stored.
5) Now for just displaying the forecasts which are above the stock, I can create a new measure with the formula below:-
UnderstockQty:=If (
Sum ( Forecast[RT_Qty] ) <= Sum ( Stock[Stock] ),
Blank ( ),
Sum ( Forecast[Qty] )
)
Notice that I am using the running total of forecast to check against the stock and not just the forecast quantity.
But this measure will not give us the final end result which is illustrated in the example below
You can see that for P2, we need to display 5 in G4 and not 75. For this, we need an additional check to see when was the first group value (or minimum sort order) when the forecast exceeded the stock.
6) Create a new measure to find the minimum Group value (or minimum order) in which the forecast exceeded the stock.
MinOrder:=Calculate (
Min ( Forecast[Order] ),
CalculateTable (
Filter (
AllExcept ( Forecast, Product[Product] ),
[RT_Qty] > Sum ( Stock[Stock] )
)
)
)
7) Now we can edit the measure to include the additional check. I am just creating a new measure called RemainingUndrStkQty so that we can compare the difference with UnderstockQty measure.
RemainingUndrStkQty:=If (
Sum ( Forecast[RT_Qty] ) <= Sum ( Stock[Stock] ),
Blank ( ),
If (
[MinOrder] = Min ( CustomGrp[Order] ),
Sum ( Forecast[RT_Qty] ) - Sum ( Stock[Stock] ),
Sum ( Forecast[Qty] )
)
)
Now you can see that we are able to get the desired results.
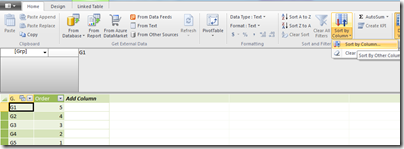
If you are the sort of person who observes carefully, then you would have noticed that I used a set for the group values in the columns. This was done so that if the user felt like changing the order for the running totals, then they can edit the set for changing the display order also. However, if you are using the new version of PowerPivot, a better idea might be to use the Sort by Column feature to sort the CustomGroup table by Order. Then you would be able to use the Group attribute directly in the columns and the changes to order would also be reflected immediately.
Now, to test whether your running total works if the order is modified, change the order column values in the reverse order for the groups as shown above, and you can see the result as well as the running totals change as shown below
 | Jason has been working with Microsoft BI tools since he joined the IT industry in 2006. Since then he has worked across SSAS, SSRS and SSIS for a large number of clients like Unilever, Imperial Tobacco, IATA, Schneider Electric, etc. He is currently working at MindTree Ltd, Bangalore (www.mindtree.com) and his personal blog site can be found at http://road-blogs.blogspot.com His blogs can also be found at the popular technical site BeyondRelational.com at http://beyondrelational.com/blogs/jason |


