Using XEvents in SSAS 2012
Reposted from Chris Webb's blog with the author's permission.
One of the few new features in SSAS 2012 Multidimensional is the ability to use Extended Events (XEvents) for monitoring purposes. I was, naturally, curious about how to use them but quickly found that thedocumentation in Books Online was completely useless – the code example given just doesn’t work. This started a number of discussions with people like Akshai Mirchandani, Nick Medveditskov, Rob Kerr, Greg Galloway, Francesco De Chirico who all helped me get to the point where I had something working, and I’m very grateful to them. This is a short summary of what I’ve learned so far; hopefully some working XMLA samples will be useful to anyone else who is researching this subject.
First of all, here’s a working XMLA command that creates an XEvent trace:
<Create xmlns=http://schemas.microsoft.com/analysisservices/2003/engine
xmlns:xsi=http://www.w3.org/2001/XMLSchema-instance
xmlns:ddl2=http://schemas.microsoft.com/analysisservices/2003/engine/2
xmlns:ddl2_2=http://schemas.microsoft.com/analysisservices/2003/engine/2/2
xmlns:ddl100_100=http://schemas.microsoft.com/analysisservices/2008/engine/100/100
xmlns:ddl200_200=http://schemas.microsoft.com/analysisservices/2010/engine/200/200
xmlns:ddl300_300="http://schemas.microsoft.com/analysisservices/2011/engine/300/300">
    <ObjectDefinition>
        <Trace>
            <ID>XEvent Demo Trace</ID>
            <Name>XEvent Demo Trace</Name>
            <ddl300_300:XEvent>
                <event_session name="xeas" dispatchLatency="1" maxEventSize="4" maxMemory="4"
                 memoryPartitionMode="none" eventRetentionMode="allowSingleEventLoss"
                 trackCausality="true">
                    <event package="AS" name="DiscoverBegin" />
                    <event package="AS" name="DiscoverEnd" />
                    <event package="AS" name="QueryBegin" />
                    <event package="AS" name="QueryEnd" />
                    <event package="AS" name="CommandBegin" />
                    <event package="AS" name="CommandEnd" />
                    <event package="AS" name="LockAcquired">
                        <action package="Package0" name="callstack"></action>
                    </event>
                    <event package="AS" name="LockReleased">
                        <action package="Package0" name="callstack"></action>
                    </event>
                    <event package="AS" name="LockWaiting">
                        <action package="Package0" name="callstack"></action>
                    </event>
                    <target package="Package0" name="event_file">
                        <parameter name="filename" value="c:\demo.xel" />
                    </target>
                </event_session>
            </ddl300_300:XEvent>
        </Trace>
    </ObjectDefinition>
</Create>
.csharpcode, .csharpcode pre
{
font-size: small;
color: black;
font-family: consolas, “Courier New”, courier, monospace;
background-color: #ffffff;
/*white-space: pre;*/
}
.csharpcode pre { margin: 0em; }
.csharpcode .rem { color: #008000; }
.csharpcode .kwrd { color: #0000ff; }
.csharpcode .str { color: #006080; }
.csharpcode .op { color: #0000c0; }
.csharpcode .preproc { color: #cc6633; }
.csharpcode .asp { background-color: #ffff00; }
.csharpcode .html { color: #800000; }
.csharpcode .attr { color: #ff0000; }
.csharpcode .alt
{
background-color: #f4f4f4;
width: 100%;
margin: 0em;
}
.csharpcode .lnum { color: #606060; }
The important parts are the list of events, which are the same as the events that can be seen in Profiler (for a full list see here), and the target node which specifies the .xel file to output to.
Once this has been executed in SQL Server Management Studio, you can verify that the trace is running by using the following DMV:
select * from
$system.discover_traces
Here’s what the output is on my machine:
There are three traces shown running here on my SSAS instance and the last in the list is the XEvent trace I’ve just created.
Having run a few queries to make sure there is something in the .xel file, the trace can be stopped by executing the following XMLA:
<Delete xmlns="http://schemas.microsoft.com/analysisservices/2003/engine">
    <Object>
        <TraceID>XEvent Demo Trace</TraceID>
    </Object>
</Delete>
.csharpcode, .csharpcode pre
{
font-size: small;
color: black;
font-family: consolas, “Courier New”, courier, monospace;
background-color: #ffffff;
/*white-space: pre;*/
}
.csharpcode pre { margin: 0em; }
.csharpcode .rem { color: #008000; }
.csharpcode .kwrd { color: #0000ff; }
.csharpcode .str { color: #006080; }
.csharpcode .op { color: #0000c0; }
.csharpcode .preproc { color: #cc6633; }
.csharpcode .asp { background-color: #ffff00; }
.csharpcode .html { color: #800000; }
.csharpcode .attr { color: #ff0000; }
.csharpcode .alt
{
background-color: #f4f4f4;
width: 100%;
margin: 0em;
}
.csharpcode .lnum { color: #606060; }
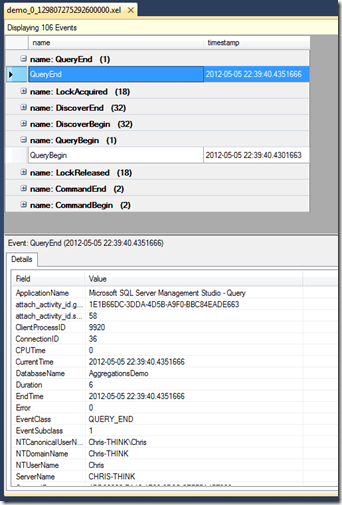
You can now open the .xel file specified in the original trace definition in SQL Server Management Studio, browse through it, sort, group events and so on:
Instead of outputting to a .xel file, it’s also possible to output to a .etl file by changing the target. Here’s an XMLA command that does this:
<Create xmlns=http://schemas.microsoft.com/analysisservices/2003/engine
xmlns:xsi=http://www.w3.org/2001/XMLSchema-instance
xmlns:ddl2=http://schemas.microsoft.com/analysisservices/2003/engine/2
xmlns:ddl2_2=http://schemas.microsoft.com/analysisservices/2003/engine/2/2
xmlns:ddl100_100=http://schemas.microsoft.com/analysisservices/2008/engine/100/100
xmlns:ddl200_200=http://schemas.microsoft.com/analysisservices/2010/engine/200/200
xmlns:ddl300_300="http://schemas.microsoft.com/analysisservices/2011/engine/300/300">
    <ObjectDefinition>
        <Trace>
            <ID>XEvent Demo Trace</ID>
            <Name>XEvent Demo Trace</Name>
            <ddl300_300:XEvent>
                <event_session name="xeas" dispatchLatency="1" maxEventSize="4" maxMemory="4"
                memoryPartitionMode="none" eventRetentionMode="allowSingleEventLoss"
                trackCausality="true">
                    <event package="AS" name="DiscoverBegin" />
                    <event package="AS" name="DiscoverEnd" />
                    <event package="AS" name="QueryBegin" />
                    <event package="AS" name="QueryEnd" />
                    <event package="AS" name="CommandBegin" />
                    <event package="AS" name="CommandEnd" />
                    <event package="AS" name="LockAcquired">
                        <action package="Package0" name="callstack"></action>
                    </event>
                    <event package="AS" name="LockReleased">
                        <action package="Package0" name="callstack"></action>
                    </event>
                    <event package="AS" name="LockWaiting">
                        <action package="Package0" name="callstack"></action>
                    </event>
                    <target package="Package0" name="etw_classic_sync_target">
                        <parameter name="default_etw_session_logfile_path" value="c:\demo.etl" />
                    </target>
                </event_session>
            </ddl300_300:XEvent>
        </Trace>
    </ObjectDefinition>
</Create>
.csharpcode, .csharpcode pre
{
font-size: small;
color: black;
font-family: consolas, “Courier New”, courier, monospace;
background-color: #ffffff;
/*white-space: pre;*/
}
.csharpcode pre { margin: 0em; }
.csharpcode .rem { color: #008000; }
.csharpcode .kwrd { color: #0000ff; }
.csharpcode .str { color: #006080; }
.csharpcode .op { color: #0000c0; }
.csharpcode .preproc { color: #cc6633; }
.csharpcode .asp { background-color: #ffff00; }
.csharpcode .html { color: #800000; }
.csharpcode .attr { color: #ff0000; }
.csharpcode .alt
{
background-color: #f4f4f4;
width: 100%;
margin: 0em;
}
.csharpcode .lnum { color: #606060; }
This gives you something that can opened in Windows Performance Analyzer:
 |
Chris has been working with Microsoft BI tools since he started using beta 3 of OLAP Services back in the late 90s. Since then he has worked with Analysis Services in a number of roles (including three years spent with Microsoft Consulting Services) and he is now an independent consultant specialising in complex MDX, Analysis Services cube design and Analysis Services query performance problems. His company website can be found at http://www.crossjoin.co.uk and his blog can be found at http://cwebbbi.wordpress.com . |
Tags: management, event, profiler


