DAX Machine Learning Functionality Used By The Key Influencers Visual In Power BI
Reposted from Chris Webb's blog with the author's permission.
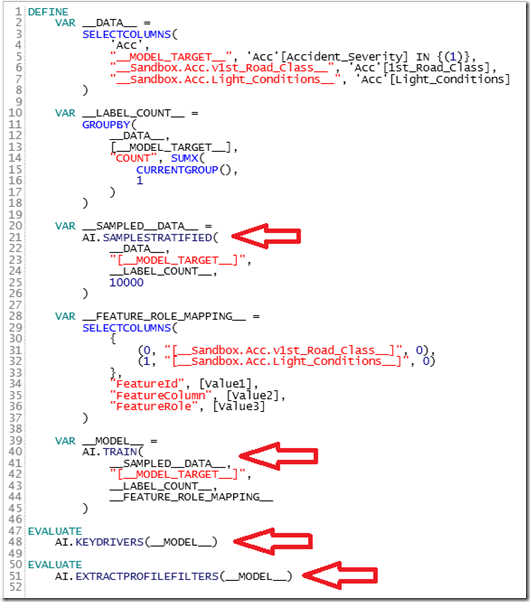
I’m one of those people who can’t resist peeking behind the scenes, and so when the Key Influencers visual appeared in Power BI I couldn’t help wondering how it worked its machine learning magic. Using DAX Studio to look at the DAX queries generated by the visual proved to be very revealing: it turns out that it uses a number of new DAX functions that are undocumented and probably not meant to be used outside Microsoft. For example, the following screenshot shows a DAX query generated by the Key Influencers visual that uses functions called AI.SampleStratified, AI.Train, AI.KeyDrivers and AI.ExtractProfileFilters:
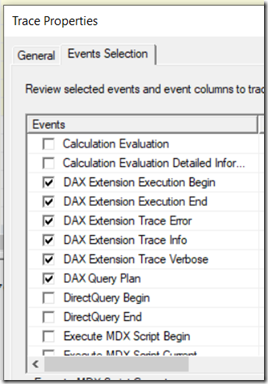
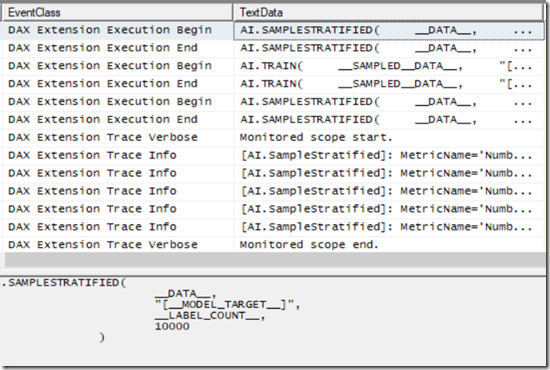
Using Profiler (in a similar way to what I describe in this post) to go into even more detail about what happens when these queries run, shows that they raise the DAX Extension events that I’ve been wondering about for a long time now:
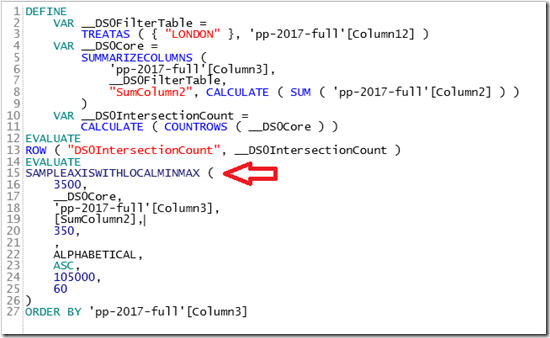
So Power BI can train and query machine learning models inside its own database engine – which, when you think about it, is pretty darned cool. And then I thought: hold on, other visuals have had machine learning features for a long time. For example, the Line Chart visual can create forecasts, but although DAX Studio shows yet another undocumented function called SampleAxisWithLocalMinMax() this does not actually seem to perform the forecasting, which I assume must be done inside the code of the visual itself:
My guess is that the functionality used by the Key Influencers visual is new functionality in the engine.
A fascinating insight into how Power BI works, but is this any practical use to us? Let me be clear: I don’t think you should be using any of these functions yourself in a real-world report. I’m sure all this would be documented and publicised if Microsoft did want us to use it ourselves! Another consideration is that these new functions return tables and that makes them awkward to use in regular .pbix Power BI reports – I guess we could create calculated tables although that’s not as flexible as returning a table from a query as shown above. That said, even though we can’t write our own DAX queries in regular Power BI reports, we can write our own DAX queries in Paginated Reports and we can now create Paginated Reports that use a Power BI dataset as a data source. I tested putting one of the queries generated by the Key Influencers visual into a Paginated Report connected to the same dataset and it worked ok (even after publishing). You can also embed DAX queries connected to a published dataset in Excel too, as I show here. Hmm, plenty to think about then…
 |
Chris has been working with Microsoft BI tools since he started using beta 3 of OLAP Services back in the late 90s. Since then he has worked with Analysis Services in a number of roles (including three years spent with Microsoft Consulting Services) and he is now an independent consultant specialising in complex MDX, Analysis Services cube design and Analysis Services query performance problems. His company website can be found at http://www.crossjoin.co.uk and his blog can be found at http://cwebbbi.wordpress.com/ . |


