The DAX Unichar() Function And How To Use It In Measures For Data Visualisation
Reposted from Chris Webb's blog with the author's permission.
A few weeks ago I was asked whether it was possible to display line breaks in text in a Power BI visualisation. It turns out it isn’t possible – at the moment Power BI always strips line breaks out of text when it gets loaded into the Data Model. However while researching this I came across the DAX Unichar() function, which returns the unicode character associated with an integer value – and which also seems to be completely undocumented for some reason, I guess because it’s new (it isn’t in Excel 2016 DAX yet as far as I can see).
It’s very straightforward to use: for example, the DAX expression UNICHAR(65) returns the character A; see here for a list of unicode characters and their associated codes. You can have a lot of fun with this function in Power BI when you use it to return symbols that in turn can be used to represent data, so I thought I would put together a few examples to show you.
Take the following table which contains scores for restaurants in the range of 0 to 5:
The following measure:
Stars =
REPT(UNICHAR(9733), AVERAGE('Restaurants'[Score]))
&
REPT(UNICHAR(9734), 5-AVERAGE('Restaurants'[Score]))
…which uses the Unichar() function to return characters 9733 and 9734, filled and unfilled stars, and the Rept() function to return a string with those characters repeated N times, can be used to create a table like this in Power BI:
[I’m sure I read a blog post somewhere that describes this trick with Rept() but I can’t find it anywhere – if you know the one I’m talking about please leave a link in the comments]
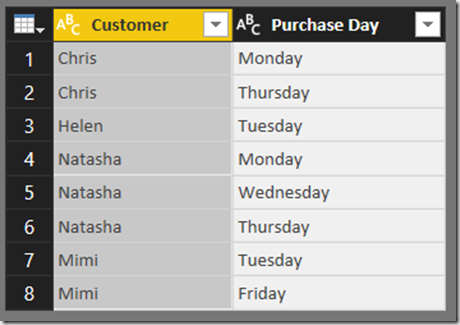
Similarly, with the following source data showing the days that customers made a purchase in a week:
…you can use the following measure, which returns characters 9635 (a square with a black dot inside) and 9634 (an empty black square), in a matrix to visualise this information:
Purchase Indicator =
IF(
	COUNTROWS('Purchase Days')>0,
		UNICHAR(9635),
		UNICHAR(9634)
)
& REPT(" ", 5)
Finally, an example using the box drawing unicode block to visualise the following date ranges (nb the dates are in dd/mm/yyyy format). Here’s the source data:
Here’s the measure, which uses characters 9500, 9472 and 9508 to draw bars:
Employment Range =
VAR OverallMinimumDate =
	CALCULATE(
		MIN('Employment Dates'[Start Date]),
		ALLSELECTED('Employment Dates'))
VAR DaysBeforeStart =
	MAX('Employment Dates'[Start Date]) -
	OverallMinimumDate
VAR DaysBetweenStartAndEnd =
	MAX('Employment Dates'[End Date]) -
	MAX('Employment Dates'[Start Date])
VAR BarsBetween =
	IF(DaysBetweenStartAndEnd>1,
		DaysBetweenStartAndEnd-2,
		0)
RETURN
	REPT(" ", DaysBeforeStart) &
	UNICHAR(9500) &
	REPT(UNICHAR(9472), BarsBetween) &
	UNICHAR(9508)
And here’s the output in a table:
You can download the Power BI .pbix file with these examples in here.
Is this going to revolutionise how you design reports? No of course not, but I think it could be a useful trick in certain scenarios. If you do come up with other creative ways to use unicode characters in your reports I would be interested to see the results!
 |
Chris has been working with Microsoft BI tools since he started using beta 3 of OLAP Services back in the late 90s. Since then he has worked with Analysis Services in a number of roles (including three years spent with Microsoft Consulting Services) and he is now an independent consultant specialising in complex MDX, Analysis Services cube design and Analysis Services query performance problems. His company website can be found at http://www.crossjoin.co.uk and his blog can be found at http://cwebbbi.wordpress.com/ . |


