Using SelectColumns() To Alias Columns In DAX
Reposted from Chris Webb's blog with the author's permission.
A few years ago I wrote this post on how to alias columns in a table in DAX, using a combination of AddColumns() and Summarize(). The good news is that in Excel 2016/the Power BI Designer/SSAS Tabular 2016 there's a new DAX function specifically for this purpose: SelectColumns(). Here's an example of how it can be used:
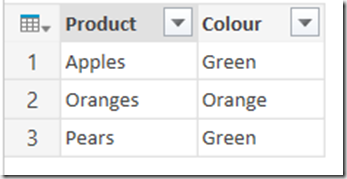
Imagine you have the following source table, called Products:
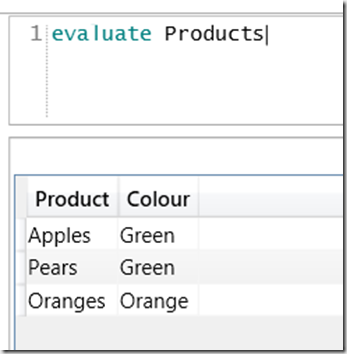
You can write a DAX query to get all the rows and columns from this table like so:
EVALUATE Products
Here's the output of that query in DAX Studio (and remember, DAX Studio can connect to data loaded into the Power BI Designer, which is what I'm doing here):
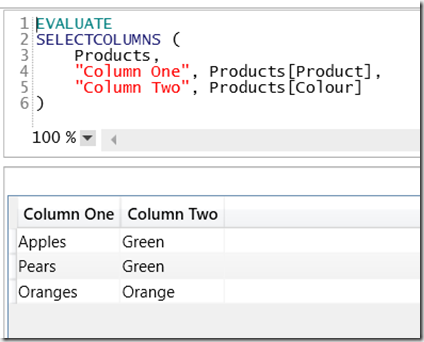
You can alias the columns in this table using SelectColumns() very easily, like so:
EVALUATE SELECTCOLUMNS ( Products, "Column One", Products[Product], "Column Two", Products[Colour] )
Here's the output:
The syntax for SelectColumns() is straightforward: the first parameter is a table expression, and after that there are pairs of parameters consisting of:
- A new column name
- An expression returning a column from the table given in the first parameter
As you can see in the output of the query above, I've renamed the Product column "Column One" and the Colour column "Column Two".
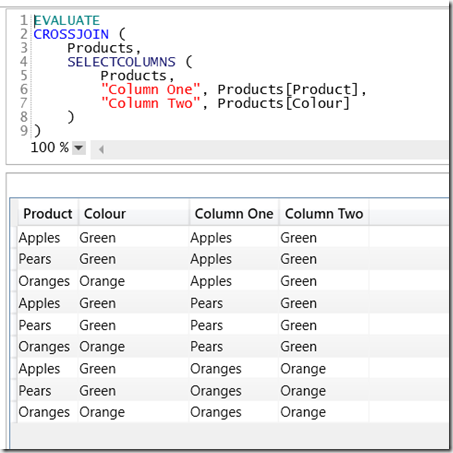
This means I can now crossjoin a table with itself without needing to worry about conflicting column names, like so:
EVALUATE CROSSJOIN ( Products, SELECTCOLUMNS ( Products, "Column One", Products[Product], "Column Two", Products[Colour] ) )
One other interesting thing to note about SelectColumns() is that it allows you to do projection in a DAX query easily – as Marco notes here, it was possible before but it wasn't pleasant. For example, the query:
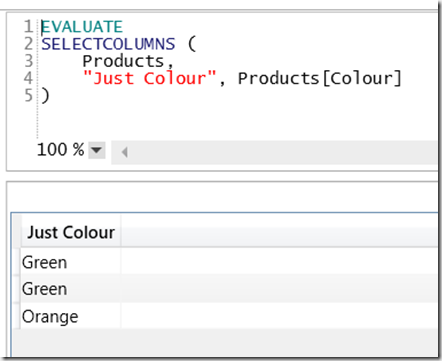
EVALUATE SELECTCOLUMNS ( Products, "Just Colour", Products[Colour] )
Returns:
Notice how there are three rows in the output here and that the value Green occurs twice. If you're a true DAX afficionado, you might get excited about that.
 | Chris has been working with Microsoft BI tools since he started using beta 3 of OLAP Services back in the late 90s. Since then he has worked with Analysis Services in a number of roles (including three years spent with Microsoft Consulting Services) and he is now an independent consultant specialising in complex MDX, Analysis Services cube design and Analysis Services query performance problems. His company website can be found at http://www.crossjoin.co.uk and his blog can be found at http://cwebbbi.wordpress.com/ . |

