Returning Selected Items in an Excel Slicer Using MDX in PowerPivot and SSAS
Reposted from Chris Webb's blog with the author's permission.
One problem I came up against recently is how to find out what has been selected on an Excel slicer connected to SSAS or a PowerPivot model. There are a number of blog posts showing solutions to this problem, both for scenarios where only one item has been selected and when multiple items have been selected, for example (look at the comments as well as the posts themselves):
http://www.powerpivotpro.com/2010/12/another-way-to-get-and-use-slicer-values-in-formulas/
http://www.powerpivotpro.com/2011/09/catching-multiple-slicer-selections-in-a-formula/
.but I've come up with a new, MDX-based approach that handles the multiple selection scenario no matter how many items there are in the slicer, and which I thought was worth blogging about. I was tempted to include this in my series on MDX for PowerPivot but since it's equally relevant for SSAS users, and the MDX is a bit complicated for an introductory series, I thought I'd make it into a standalone post.
To describe this technique I'm going to use same PowerPivot model I describe here, which is based on the AdventureWorks DW sample database. First of all, create a new PivotTable with CalendarYear in a slicer and CalendarYear on rows and any relevant measure on columns:
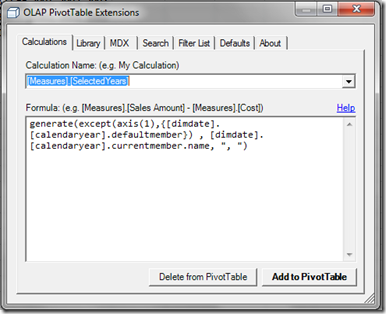
Selecting a Year in the slicer means that that Year appears on rows in the PivotTable, and selecting multiple years means multiple rows are displayed, as you would expect. Next you need to add a new MDX calculated measure to the PivotTable. If you're using SSAS you can simply add the calculation onto your cube or you can use the OLAP PivotTable Extensions addin; for PowerPivot users the OLAP PivotTable Extensions approach is the only option, so that's what I'll demonstrate. Right-click inside the PivotTable and choose OLAP PivotTable Extensions from the right-click menu, and then in the Calculations tab create a new calculation called SelectedYears with the following definition:
Generate(
Except(
Axis(1)
, {[DimDate].[CalendarYear].Defaultmember}
)
, [DimDate].[CalendarYear].Currentmember.Name
, ", "
)
.and click Add to PivotTable. The result will be a new measure that returns a comma-delimited list of the names of everything selected on the rows axis of the query, and therefore everything selected in the slicer:
How does this work? Well, first of all Axis(1) is used to return the set used on the rows axis of the query used to populate the PivotTable (incidentally, this is why it's important to have another measure in the PivotTable - if it's not there, the structure of the query generated by Excel will be different and while the MDX can be altered to handle this, some of the items in the slicer will be partially greyed-out). The set returned by Axis(1) will include the All Member of the CalendarYear hierarchy, so the Except() function is used to remove it; finally, the Generate() function is used to iterate over this set and return the comma-delimited list of member names. In this example the CalendarYear field on the DimDate table in my PowerPivot model has become the MDX hierarchy with the unique name [DimDate].[CalendarYear]; please read this post for some background on how PowerPivot objects map to MDX objects.
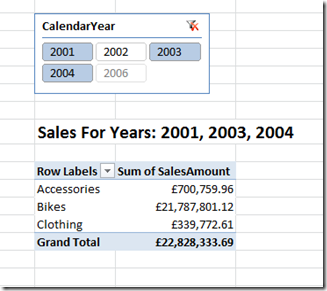
Now you have the PivotTable you can refer to the top-right cell in it (in this example it's cell F3) in it to return the list of years and hide the PivotTable itself; this allows you to create dynamic titles like the following:
="Sales For Years: " & F3
You can then also create other, new PivotTables and hook them up to the original slicer and they will all work as normal:
 | Chris has been working with Microsoft BI tools since he started using beta 3 of OLAP Services back in the late 90s. Since then he has worked with Analysis Services in a number of roles (including three years spent with Microsoft Consulting Services) and he is now an independent consultant specialising in complex MDX, Analysis Services cube design and Analysis Services query performance problems. His company website can be found at http://www.crossjoin.co.uk and his blog can be found at http://cwebbbi.wordpress.com/ . |


