Building a Simple BI Solution in Excel 2013, Part 2
Reposted from Chris Webb's blog with the authors permission.
In part 1 of this series I showed how to build a BI dashboard with UK weather data in Excel 2013. What I’m going to do now is show, very quickly, how this dashboard can be shared with other people via a web browser.
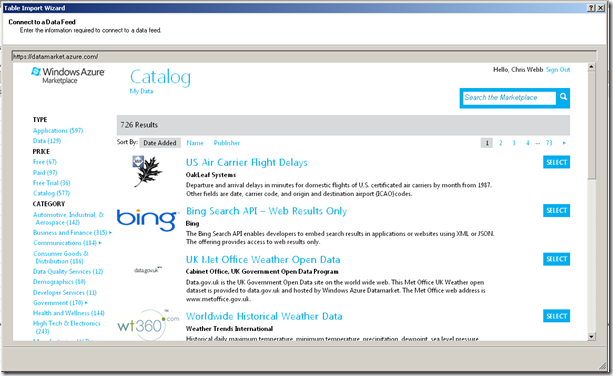
Before I do that, though, an aside: I found a bug in the preview version of Excel 2013 which means that the dashboard I built in the previous post won’t work with what I’m going to describe here. It’s related to how I imported the data – in my last post I imported data from the Azure DataMarket from the Data tab, and what I’ve had to do for this post is import data from inside the PowerPivot window instead. In a way it’s a good thing I did this because the UI for importing data from the Azure DataMarket in PowerPivot is much better than what I showed before (although it too is quite buggy at the moment). No more fumbling around for account keys and OData queries in the way that Rob Collie complains about here, it’s all handled from within the wizard. All you need to do is pick a data set:
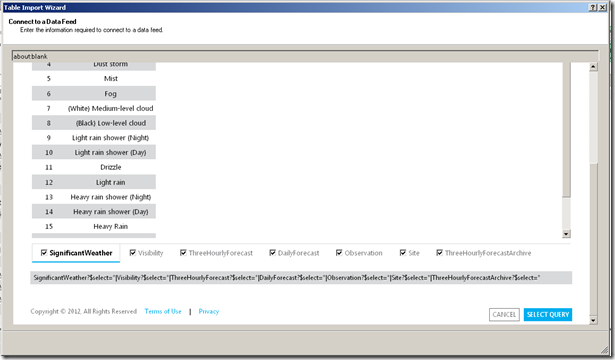
And then check the tables you want and optionally apply filters to certain columns that support it:
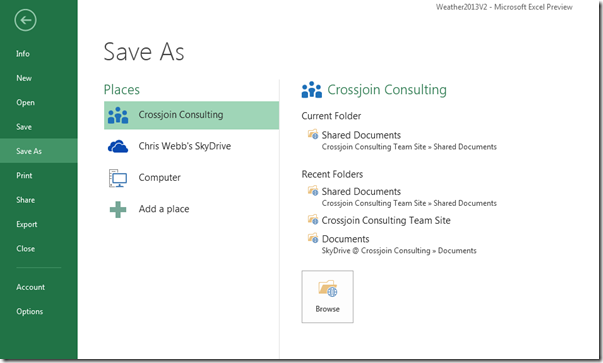
Anyway, with my workbook rebuilt, the next thing I’m going to do is save it. There’s actually a lot more to saving in Office 2013 than you might expect, and certainly lots of different options for places to save stuff too, so I recommend you read this post to get a feeling of what’s possible. I’ve signed up for the Office 365 Professional Plus Preview which means I have access to all kinds of cloud-based services including Sharepoint in the cloud, so I can save my workbook up to Sharepoint:
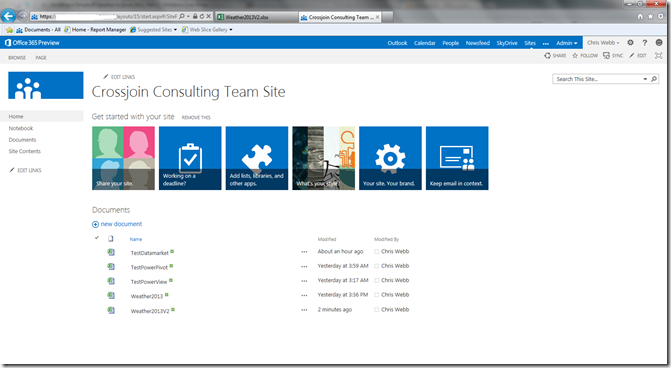
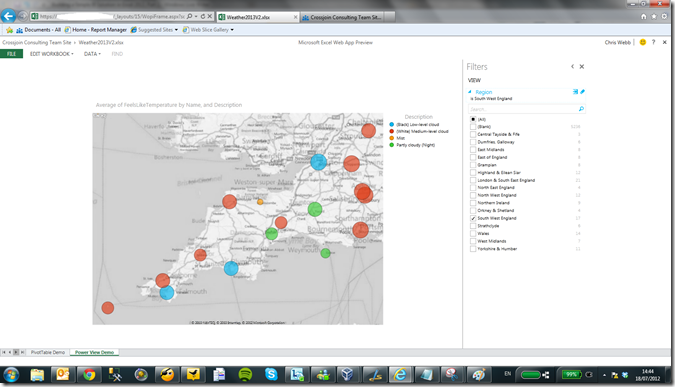
I can then go to my Sharepoint site on another computer and view and interact with my dashboard using Office Web Apps in the browser:
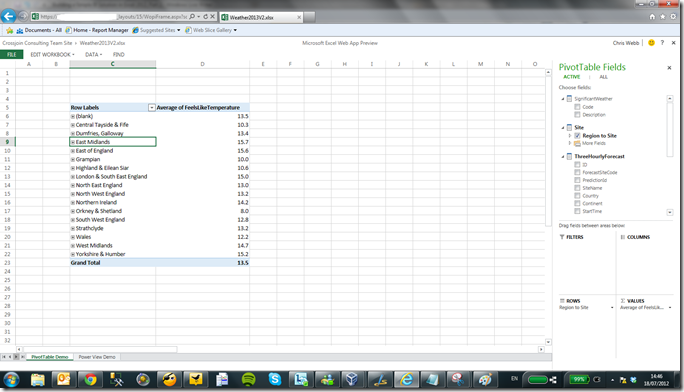
Yes, that’s my Power View dashboard in a web browser – and I can change filters and it all works! Here’s my PivotTable:
I can not only drill down, but I can even change what’s on rows and columns by dragging and dropping fields in the Field list in the usual way. It’s a bit slow and (again) a bit buggy at the moment, but by RTM I can see this being a big selling point: anyone with Office 365 will have in place everything they need not only for BI on the desktop, but for sharing their reports over the web (though data refresh may be a problem here). I’m very impressed, and it’s good to see such a strong answer to the question I asked here last year.
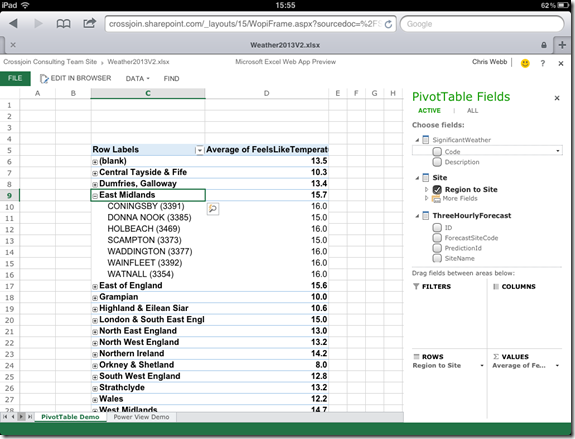
Finally, the question I know you’re all dying to ask. Does this work on an iPad? Well, yes and no. The PivotTable works properly and there’s no loss of interactivity, although I’d say that the touch interface doesn’t work all that smoothly yet:
Unfortunately the Power View sheet doesn’t work at all – no Silverlight!
Oh well, maybe that was too much to ask for… this is clearly not the Microsoft mobile BI solution that was promised at PASS last year. That’s not to say it isn’t useful though – there’s still some good stuff you can do with PivotTables and regular Excel sheets. I’m still very happy with what’s been delivered so far!
 |
Chris has been working with Microsoft BI tools since he started using beta 3 of OLAP Services back in the late 90s. Since then he has worked with Analysis Services in a number of roles (including three years spent with Microsoft Consulting Services) and he is now an independent consultant specialising in complex MDX, Analysis Services cube design and Analysis Services query performance problems. His company website can be found at http://www.crossjoin.co.uk and his blog can be found at http://cwebbbi.wordpress.com . |

