Natural and Unnatural Hierarchies in the SSAS 2012 Tabular Model
Reposted from Chris Webb's blog with the author's permission.
I’m sure you’re all aware of the difference between natural and unnatural user hierarchies in the Analysis Services Multidimensional model (if you’re confused as to what I mean when I say ‘Multidimensional model’, have a quick read of this post from a few weeks ago which explains the terminology). To recap, natural user hierarchies in Multidimensional look like this in BIDS:
There is a one-to-many set of attribute relationships between each level, so each Calendar Year has multiple Calendar Semesters but one Calendar Semester has only one Calendar Year, and they are a Good Thing as far as query performance is concerned. Unnatural user hierarchies look like this:
They work, but there aren’t one-to-many relationships between every level and query performance may be worse than with a natural user hierarchy.
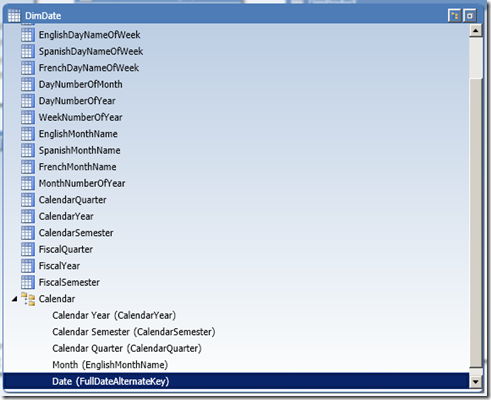
But what does all this have to do with the Tabular model? In SSDT when you create a hierarchy there’s no indication as to whether it’s natural or unnatural:
…and up to recently I assumed that this was an issue that simply wasn’t relevant to Tabular. However, after a recent conversation with Marius Dumitru from the dev team and Greg Galloway I now know this isn’t the case!
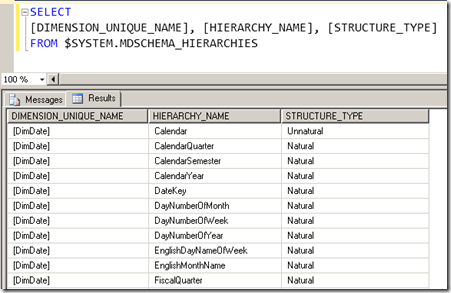
If you query the MDSCHEMA_HIERARCHIES DMV as follows:
SELECT
[DIMENSION_UNIQUE_NAME], [HIERARCHY_NAME], [STRUCTURE_TYPE]
FROM $SYSTEM.MDSCHEMA_HIERARCHIES
You can see whether a hierarchy in a Tabular model is natural or unnatural:
In this case you can see that the Calendar hierarchy that I created on the DimDate table is unnatural; SSAS has determined this during processing (specifically during the Process ReCalc stage) by examining the data itself automatically.
It turns out that natural hierarchies in Tabular can result in faster query performance because certain MDX and Formula Engine code paths in the SSAS engine are still not optimised for unnatural hierarchies. I don’t have any specific examples of when this occurs at the moment but if I do find them I’ll be sure to update this post. And if anyone else using Tabular, or even PowerPivot (and I assume this is relevant to PowerPivot too) finds a good example of how changing to a natural user hierarchy improves performance please leave a comment.
In the example above, I created the Calendar hierarchy in the Tabular model by simply dragging the CalendarYear, CalendarSemester, CalendarQuarter, EnglishMonthName and FullDateAlternateKey columns underneath each other in the new hierarchy. It’s unnatural because there are only two distinct values in Calendar Semester (the semester numbers 1 and 2), four distinct values in Calendar Quarter (the quarter numbers 1 to 4) and there are only twelve distinct values in EnglishMonthName (the names of the months), so there is a many-to-many relationship between the values in all these columns. I can make it natural by creating three calculated columns that concatenate CalendarYear and CalendarSemester, CalendarYear and CalendarQuarter, and CalendarYear and EnglishMonthName as follows:
DimDate[Calendar Semester of Year] =DimDate[CalendarYear] & " " & DimDate[CalendarSemester]
DimDate[Calendar Quarter of Year] = DimDate[CalendarYear] & " Q" & DimDate[CalendarQuarter]
DimDate[Calendar Month of Year] = DimDate[CalendarYear] & " " & DimDate[EnglishMonthName]
Using these calculated columns for the Semester, Quarter and Month levels of the hierarchy as follows:
…will make the Calendar hierarchy natural:
 |
Chris has been working with Microsoft BI tools since he started using beta 3 of OLAP Services back in the late 90s. Since then he has worked with Analysis Services in a number of roles (including three years spent with Microsoft Consulting Services) and he is now an independent consultant specialising in complex MDX, Analysis Services cube design and Analysis Services query performance problems. His company website can be found at http://www.crossjoin.co.uk and his blog can be found at http://cwebbbi.wordpress.com . |
Tags: performance, tabular


