Using Slicer Selections In The CubeSet Function
Reposted from Chris Webb's blog with the author's permission.
I had an interesting challenge from a customer yesterday - one of those problems that I'd known about for a long time but never got round to working out the solution for.
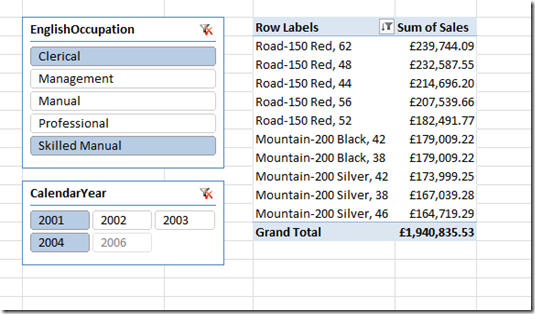
Consider the following PivotTable, based on a PowerPivot model using Adventure Works data, in Excel 2010:
It shows the top 10 products by the measure Sum of Sales. There are two slicers, and the top 10 shown in the PivotTable reflects the selections made in the slicers. All of this works fine. But what if you want to use Excel cube functions to do the same thing? You can write the MDX for the top 10 products quite easily and use it in the CubeSet() function in your worksheet, but how can you get your MDX set expression to respect the selection made in the slicers?
The solution to this problem is very similar to the trick I showed here - finding the selected items in a slicer is not easy! Here are the steps I followed to do it:
- Add the slicers for EnglishOccupation and CalendarYear to a new worksheet
- Go to Slicer Settings and uncheck the box for "Visually indicate items with no data"
- Add two new PivotTables to the worksheet. Connect one to the EnglishOccupation slicer and put EnglishOccupation on rows; connect the other to the CalendarYear slicer and put CalendarYear on rows.
- Use the OLAPPivotTableExtensions add-in (which you can download here) to add new MDX calculated measures to each PivotTable. For the EnglishOccupation PivotTable call the measure SelectedOccupations and use the following MDX:
SetToStr(Except(Axis(0), {[Customer].[EnglishOccupation].[All]}))
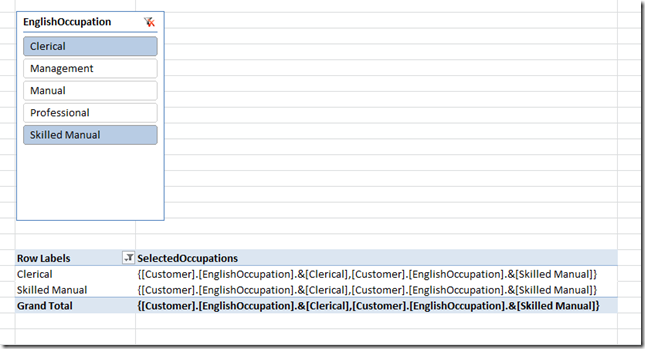
This expression does the following: it uses the Axis() function to find the set of members selected on what Excel thinks of as the rows axis in the PivotTable (actually the MDX columns axis), then uses Except() to remove the All Member from the hierarchy (which Excel uses for the Grand Totals) and then uses SetToStr() to take that set and return the string representation of it. Do the same thing for the PivotTable showing CalendarYear too, calling the calculated measure SelectedYears; the MDX in this case is:
SetToStr(Except(Axis(0), {[Date].[CalendarYear].[All]}))
This is what the EnglishOccupation PivotTable should look like:
- Next, to make things easy, use Excel formulas to get the values from the top cell inside each PivotTable into cells elsewhere in the worksheet, and give these cells the names SelectedOccupations and SelectedYears.

- Then enter a CubeSet() function into a new cell using the following formula:
=CUBESET(
"PowerPivot Data",
"Topcount(
[Product].[EnglishProductName].[EnglishProductName].members,
10,
Sum(" & SelectedOccupations & " * " & SelectedYears & ",[Measures].[Sum of Sales])
)",
"Top 10 Set")
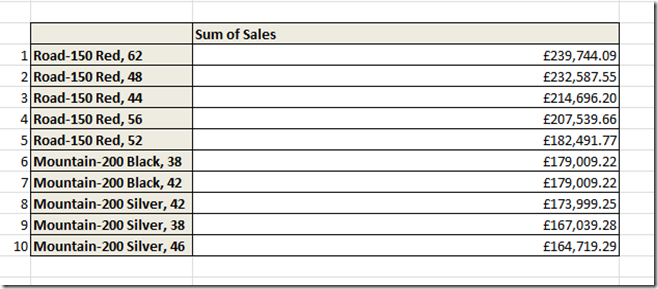
What this does is use the TopCount() function to find the top 10 Products, and in the third parameter of this function which is the numeric expression to find the top 10 by, it crossjoins the two sets of selected occupations and selected years and then sums the output of the crossjoin by the measure [Sum of Sales]. - Last of all, build your report using the Excel cube functions as normal, using the CubeRankedMember() function to get each item from the top 10 set created in the previous step.
You can download my sample workbook here.
The bad news about this technique is that it doesn't work in Excel 2013 and Power Pivot. It's no longer possible to create MDX calculated measures on Power Pivot models in Excel 2013, alas. It will work if you're using any version of Excel from 2007 on against Analysis Services and, as I show here, Excel 2010 and PowerPivot. If you are using Power Pivot and Excel 2013 it might be possible to create a DAX measure to do the same as the MDX I've used here (I'm wondering if the technique Jason describes here will work). It would certainly be possible to use CubeRankedMember() to find each item selected in the slicer, as Erik Svensen shows here, and then use Excel formulas to find the MDX unique name for each selected member and concatenate these unique names to create the set expression that my calculated measures return, but that's a topic for another post. This really should be a lot easier than it is.
 | Chris has been working with Microsoft BI tools since he started using beta 3 of OLAP Services back in the late 90s. Since then he has worked with Analysis Services in a number of roles (including three years spent with Microsoft Consulting Services) and he is now an independent consultant specialising in complex MDX, Analysis Services cube design and Analysis Services query performance problems. His company website can be found at http://www.crossjoin.co.uk and his blog can be found at http://cwebbbi.wordpress.com/ . |


