
Excel slicer impact on query performance
Excel 2010 introduced a new feature called slicers that helps visually filter your data in a more interactive way than the old filters. There are two ways you can add slicers to your SSAS pivot report:
- Select any cell in the pivot table area and then choose the "Options" menu item, then the "Insert Slicer" menu item, and then from the drop down list select "Insert Slicer". Then select the attribute that you would like to be in the slicer
- Select any cell in the pivot table are and then choose the "Insert" menu item and then "Slicer"
Here is a screenshoot of adding a slicer using the first option:
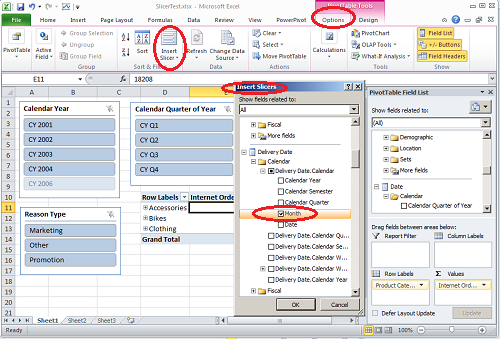
In the picture above you can see a report with slicers for "Calendar Year", "Calendar Quarter of Year" and "Reason Type" and you can also see that from the "Insert Slicer" dialog I am choosing to add a slicer for "Month".
Slicers usually make your report more visually appealing, but there might be a performance impact that you should be aware of. I already wrote a post about how slicers impact PowerPivot performance. In this post we will investigate how slicers affect the performance of Pivot reports that are based on SSAS data.
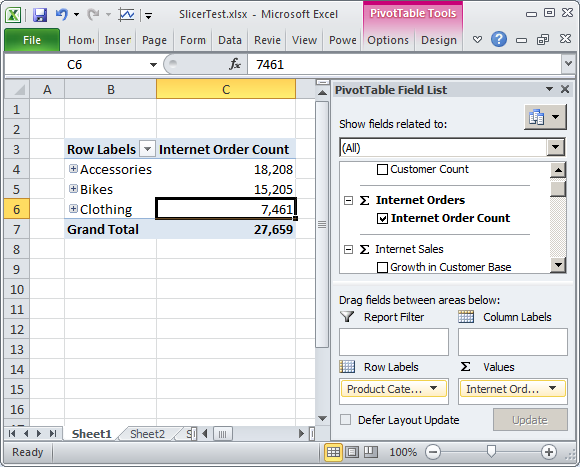
I'll start with a very simple report that shows Product Categories on the rows and one measure [Internet Order Count] on columns (from Adventure Works cube). This is how this report looks in Excel:
Excel generates the following MDX query for this report (captured using SQL Server Profiler):
SELECT NON EMPTY Hierarchize({DrilldownLevel({[Product].[Product Categories].[All Products]},,,INCLUDE_CALC_MEMBERS)}) DIMENSION PROPERTIES PARENT_UNIQUE_NAME,HIERARCHY_UNIQUE_NAME ON COLUMNS
FROM [Adventure Works]
WHERE ([Measures].[Internet Order Count])
CELL PROPERTIES VALUE, FORMAT_STRING, LANGUAGE, BACK_COLOR, FORE_COLOR, FONT_FLAGS
Now I will add a slicer for Calendar Year without selecting any slicer member so that our report will look like this:
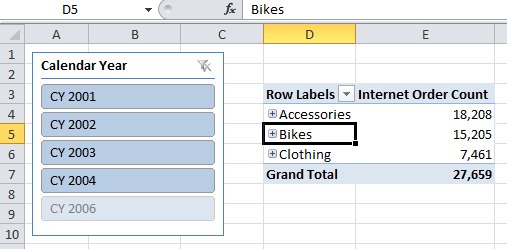
As you can see, the Calendar Year slicer shows all of the year members, but member [CY 2006] has lighter shade - that is because the slicer also shows which members have data in your report. This is very convenient, as just by looking at the report you already know that in calendar year 2006 there are no orders. But to get this information Excel has to send more MDX queries to SSAS. Here is an MDX query generated by the above report with my comments in green:
// Query1: Returns strings representing selected slicer members unique name (or All member unique name if no slicer members selected):
// XL_PT0
// [Date].[Calendar Year].[All Periods]
WITH MEMBER [Date].[Calendar Year].[XL_PT0] AS 'strtomember("[Date].[Calendar Year].[All Periods]").UniqueName'
SELECT {[Date].[Calendar Year].[XL_PT0]} ON 0 FROM [Adventure Works] CELL PROPERTIES VALUE
go
// Query2: Main query that returns results based on slicer selection:
// All Products Accessories Bikes Clothing
// 27659 18208 15205 7461
SELECT NON EMPTY Hierarchize({DrilldownLevel({[Product].[Product Categories].[All Products]},,,INCLUDE_CALC_MEMBERS)})
DIMENSION PROPERTIES PARENT_UNIQUE_NAME,HIERARCHY_UNIQUE_NAME ON COLUMNS
FROM [Adventure Works]
WHERE ([Date].[Calendar Year].[All Periods],[Measures].[Internet Order Count])
CELL PROPERTIES VALUE, FORMAT_STRING, LANGUAGE, BACK_COLOR, FORE_COLOR, FONT_FLAGS
go
// Query3: Returns total number of slicer members:
// __XLolapslicermembercount
// 5
WITH MEMBER [Measures].__XLolapslicermembercount AS [Date].[Calendar Year].[Calendar Year].allmembers.count
SELECT { [Measures].__XLolapslicermembercount } on 0
FROM [Adventure Works] cell properties value
go
// Query4: Returns slicer member captions and value 1 when it has value and 0 when it does not have value in current report:
// __XLRelated
// CY 2005 1
// CY 2006 1
// CY 2007 1
// CY 2008 1
// CY 2010 0
WITH
SET __XLSlice0 as { [Product].[Product Categories].[All Products] } //Report dimension Grand Total member
SET __XLSlice1 as { [Measures].[Internet Order Count] } // Report measure(s)
SET __XLExistingMembers as NonEmpty([Date].[Calendar Year].[Calendar Year].allmembers, CrossJoin(__XLSlice0, __XLSlice1) ) // Slicer members that have values
SET __XLExistingRangeMembers as SubSet(__XLExistingMembers, 0, 1000) // First up to 1000 slicer members with values in report
// slicer members that do not have data in the report. Member count from previous and this set should not be more than 1000
SET __XLNonExistingRangeMembers as
IIF(__XLExistingRangeMembers.Count = 1000, {},
SubSet(
Except([Date].[Calendar Year].[Calendar Year].allmembers, __XLExistingMembers) // Calendar year members that do not have values
, iif (0 - __XLExistingMembers.Count < 0, 0, 0 - __XLExistingMembers.Count) // Start position for subset
, 1000 // count for subset
)
)
MEMBER [Measures].__XLRelated as Intersect( [Date].[Calendar Year].currentmember, __XLExistingRangeMembers ).Count
SET __XLTargetSet as SubSet(Union(__XLExistingRangeMembers, __XLNonExistingRangeMembers), 0, 1000)
SELECT { [Measures].__XLRelated } ON 0, __XLTargetSet ON 1
FROM [Adventure Works] cell properties value
go
When you have a slicer on your Excel worksheet, Excel submits 4 queries to Analysis Services. From the example above we can see that query number 1 and query number 3 are trivial queries to return dimension member list or dimension member count. We can safely assume that these 2 queries will not have any impact on our total report performance. Query number 2 is the main query that returns results for our report and it is the same as it was in our first example without a slicer. Query 4 is an additional query that calculates for each slicer member if it has values in the report so it can display that member in a different color shade. This is an additional query that you should be aware of, especially the part that has red font color. In this query SSAS identifies all slicer members that have value in your report. If your reports are fast, most likely you will never notice that there is additional query executed with slicer. But if you have reports that take a while to execute, then you might notice that adding slicer makes them even slower. In such cases you have to decide if that performance degradation is acceptable to you, or if you want for example replace that slicer with a filter.
Lets look at one more example, where we have 2 slicers.
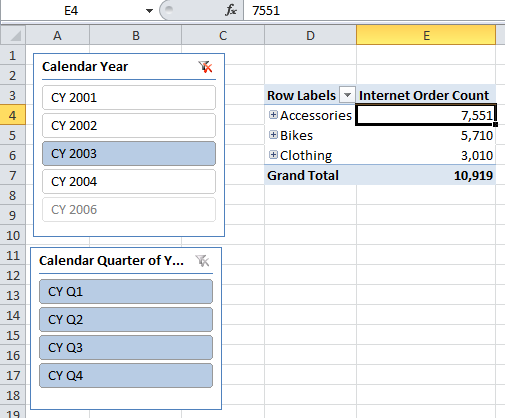
Lets add one more slicer - calendar quarter and from the Calendar Year slicer let's select [CY 2003]. With this change our report will look like this:
With this change Excel will execute the following queries in SSAS:
// Query 1: Returns string representing unique name of selected Calendar Year slicer members
// Result:
// XL_PT0
// [Date].[Calendar Year].&[2003]
WITH MEMBER [Date].[Calendar Year].[XL_PT0] AS 'strtomember("[Date].[Calendar Year].&[2003]").UniqueName'
SELECT {[Date].[Calendar Year].[XL_PT0]} ON 0
FROM [Adventure Works] CELL PROPERTIES VALUE
go
// Query 2: Returns string representing unique name of selected Calendar Quarter slicer members
// Result:
//XL_PT0
// [Date].[Calendar Quarter of Year].[All Periods]
WITH MEMBER [Date].[Calendar Quarter of Year].[XL_PT0] AS 'strtomember("[Date].[Calendar Quarter of Year].[All Periods]").UniqueName'
SELECT {[Date].[Calendar Quarter of Year].[XL_PT0]} ON 0
FROM [Adventure Works] CELL PROPERTIES VALUE
go
// Query 3: Main query that returns our report results
// Result:
// All Products Accessories Bikes Clothing
// 10919 7551 5710 3010
SELECT NON EMPTY Hierarchize({DrilldownLevel({[Product].[Product Categories].[All Products]},,,INCLUDE_CALC_MEMBERS)})
DIMENSION PROPERTIES PARENT_UNIQUE_NAME,HIERARCHY_UNIQUE_NAME ON COLUMNS
FROM [Adventure Works]
WHERE ([Date].[Calendar Quarter of Year].[All Periods],[Date].[Calendar Year].&[2003],[Measures].[Internet Order Count])
CELL PROPERTIES VALUE, FORMAT_STRING, LANGUAGE, BACK_COLOR, FORE_COLOR, FONT_FLAGS
go
//Query 4: Returns total number of Calendar Year slicer members
// Result:
// __XLolapslicermembercount
// 5
WITH MEMBER [Measures].__XLolapslicermembercount as [Date].[Calendar Year].[Calendar Year].allmembers.count
SELECT { [Measures].__XLolapslicermembercount } on 0
FROM [Adventure Works]
cell properties value
go
//Query 5: Returns calendar year slicer members and value 1 if slicer member has values in the report and 0 otherwise. This is query that potentially can affect performance
// Result:
// __XLRelated
// CY 2001 1
// CY 2002 1
// CY 2003 1
// CY 2004 1
// CY 2006 0
WITH
SET __XLSlice0 as { [Product].[Product Categories].[All Products] }
SET __XLSlice1 as { [Date].[Calendar Quarter of Year].[All Periods] }
SET __XLSlice2 as { [Measures].[Internet Order Count] }
SET __XLExistingMembers as NonEmpty([Date].[Calendar Year].[Calendar Year].allmembers,CrossJoin(__XLSlice0,__XLSlice1,__XLSlice2))
SET __XLExistingRangeMembers as SubSet(__XLExistingMembers, 0, 1000)
SET __XLNonExistingRangeMembers as
IIF(__XLExistingRangeMembers.Count = 1000, {},
SubSet( Except([Date].[Calendar Year].[Calendar Year].allmembers, __XLExistingMembers),
IIF (0 - __XLExistingMembers.Count < 0, 0, 0 - __XLExistingMembers.Count), 1000 )
)
MEMBER [Measures].__XLRelated as Intersect( [Date].[Calendar Year].currentmember, __XLExistingRangeMembers ).Count
SET __XLTargetSet as SubSet(Union(__XLExistingRangeMembers, __XLNonExistingRangeMembers), 0, 1000)
SELECT { [Measures].__XLRelated } on 0, __XLTargetSet on 1
FROM [Adventure Works] cell properties value
go
//Query 6: Returns total number of Calendar Quarter slicer members
// Result:
// __XLolapslicermembercount
// 4
WITH MEMBER [Measures].__XLolapslicermembercount as [Date].[Calendar Quarter of Year].[Calendar Quarter of Year].allmembers.count
SELECT { [Measures].__XLolapslicermembercount } on 0
FROM [Adventure Works] cell properties value
go
//Query 7: Returns calendar quarter slicer members and value 1 if slicer member has values in the report and 0 otherwise. This is query that potentially can affect performance
// Result:
// __XLRelated
// CY Q1 1
// CY Q2 1
// CY Q3 1
// CY Q4 1
WITH
SET __XLSlice0 as { [Product].[Product Categories].[All Products] }
SET __XLSlice1 as { [Date].[Calendar Year].&[2003] }
SET __XLSlice2 as { [Measures].[Internet Order Count] }
SET __XLExistingMembers as NonEmpty([Date].[Calendar Quarter of Year].[Calendar Quarter of Year].allmembers,
CrossJoin(__XLSlice0,__XLSlice1,__XLSlice2))
SET __XLExistingRangeMembers as SubSet(__XLExistingMembers, 0, 1000)
SET __XLNonExistingRangeMembers as IIF(__XLExistingRangeMembers.Count = 1000, {},
SubSet( Except([Date].[Calendar Quarter of Year].[Calendar Quarter of Year].allmembers, __XLExistingMembers),
IIF (0 - __XLExistingMembers.Count < 0, 0, 0 - __XLExistingMembers.Count), 1000 )
)
MEMBER [Measures].__XLRelated as Intersect( [Date].[Calendar Quarter of Year].currentmember, __XLExistingRangeMembers ).Count
SET __XLTargetSet as SubSet(Union(__XLExistingRangeMembers, __XLNonExistingRangeMembers), 0, 1000)
SELECT { [Measures].__XLRelated } on 0, __XLTargetSet on 1
FROM [Adventure Works] cell properties value
go
From the example above you can see that each slicer introduces an additional MDX query that check if slicer members have values for your report.
If performance is important for your report, but you still would like to use slicers, then consider changing the slicer setting "Visually Indicate Items with no data". You can change this setting by right mouse clicking on your slicer and choosing the menu option "Slicer settings...":
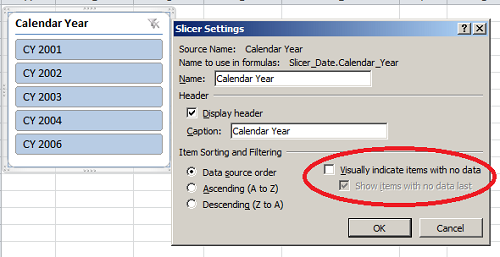
When you uncheck the "Visually indicate items with no data" checkbox, then the MDX query submitted will not check if slicer members have values in your report, so your report will run faster. Here is an MDX query generated for the report that has the "Calendar Year" slicer but with the setting changed:
// Query 1
WITH MEMBER [Date].[Calendar Year].[XL_PT0] AS 'strtomember("[Date].[Calendar Year].[All Periods]").UniqueName'
SELECT {[Date].[Calendar Year].[XL_PT0]} ON 0
FROM [Adventure Works] CELL PROPERTIES VALUE
go
// Query 2
SELECT NON EMPTY Hierarchize({DrilldownLevel({[Product].[Product Categories].[All Products]},,,INCLUDE_CALC_MEMBERS)})
DIMENSION PROPERTIES PARENT_UNIQUE_NAME,HIERARCHY_UNIQUE_NAME ON COLUMNS
FROM [Adventure Works]
WHERE ([Date].[Calendar Year].[All Periods],[Measures].[Internet Order Count])
CELL PROPERTIES VALUE, FORMAT_STRING, LANGUAGE, BACK_COLOR, FORE_COLOR, FONT_FLAGS
go
// Query 3
with member [Measures].__XLolapslicermembercount as [Date].[Calendar Year].[Calendar Year].allmembers.count
select { [Measures].__XLolapslicermembercount } on 0
from [Adventure Works]
cell properties value
go
// Query 4:
WITH
SET __XLTargetSet as SubSet([Date].[Calendar Year].[Calendar Year].allmembers, 0, 1000)
SELECT __XLTargetSet on 1, {} on 0
from [Adventure Works]
cell properties value
go
As you can see from the above MDX statement that with this changed option Query 4 is much simplier and simply returns the first 1000 slicer members.
Conclusion
Slicers are new nice visual controls introduced in Excel 2010 that allows to filter your data and at the same time allow you to see all filter options. I especially like the fact that slicers lets you see which members have data in your report. In multiple cases I found that having slicers in your report makes them much more informative then just having a filter. If you noticed that introducing slicers made your report slower, you should consider changing the slicer option "Visually indicate items with no data". With this option unchecked you will will be able to use slicers with no impact on performance, but you will not be able to see what slicer members do not have data for your report.
Tags: excel, mdx, performance