Investigating the Resource Usage Profiler Event
Reposted from Chris Webb's blog with the author's permission.
As I mentioned a few months back, some new functionality snuck into SSAS with SQL 2008 R2 SP1, the most interesting of which is a new Profiler event called Resource Usage (Thomas Ivarsson recently blogged about some other new events too). I’ve been doing some investigations on it recently, and asking the SSAS dev team what the information it returns actually means (Akshai Mirchandani is the source for much of the content of this post and I’m very grateful for his help), so I thought I’d blog my findings.
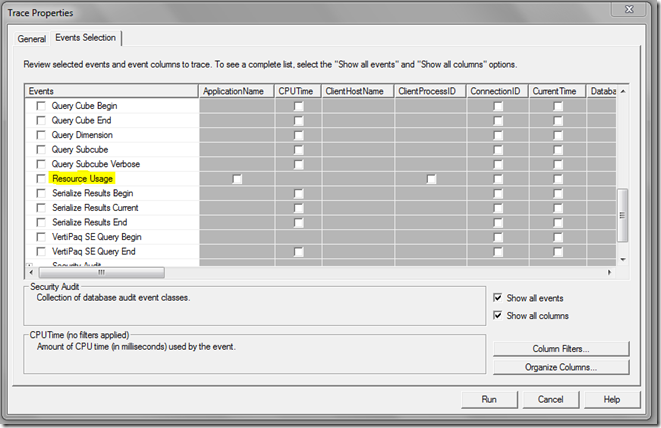
When you’re defining a new trace, you can find the Resource Usage event in the Query Processing section as shown below:
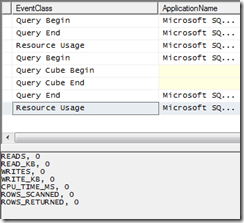
It is raised immediately after a query has finished executing (in which case it follows the Query End event):
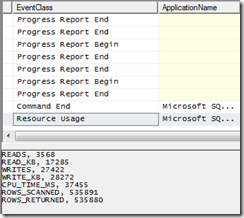
It is also raised after any XMLA command has finished executing, and this means you’re also able to use it to monitor the resource usage of a processing operation:
Essentially, it gives you information that is very similar to what’s already available in Perfmon but specific to a particular query or command. The problem with Perfmon is that it’s easy to spot strange things happening in the data it gives you, but there’s no sure-fire way of linking what you see in Perfmon back to individual events such as queries executing; the Resource Usage event solves this problem.
Here’s a breakdown of the data returned by the event:
- READS: The number of disk read operations tracked for this query
- READ_KB: The size of disk reads in KB
- WRITES: The number of disk write operations tracked for this query
- WRITE_KB: The size of disk writes in KB
- CPU_TIME_MS: The CPU time as measured in milliseconds for this query (although this seems to bear very little relation to the CPU time shown elsewhere in Profiler – perhaps it is only the CPU time for the Storage Engine?)
- ROWS_SCANNED: The number of rows scanned (decoded/filtered/aggregated) by the Storage Engine for this query
- ROWS_RETURNED: The number of rows resulting from the scans after decoding/filtering/aggregation by the Storage Engine for this query
The data returned relates purely to Storage Engine operations as far as I can see and does not relate to the Formula Engine – I get no values back for queries that hit the Storage Engine cache but are nonetheless slow because they are Formula Engine bound.
To investigate things further, I took a look at three queries (slightly modified to run on my antique version of Adventure Works) from Jeffrey Wang’s recent post on prefetching, which illustrate scenarios where the Storage Engine does radically different amounts of work; they’re particularly interesting because Jeffrey describes in detail what goes on in the Storage Engine when each of them run. First of all, the first test query from Jeffrey’s post where prefetching does not take place gives me the following values for Resource Usage on a cold cache:
READS, 8
READ_KB, 361
WRITES, 0
WRITE_KB, 0
CPU_TIME_MS, 15
ROWS_SCANNED, 18210
ROWS_RETURNED, 337
On a warm cache (ie in a situation where the Storage Engine does not need to go to disk because it can get the values it needs from cache) I get the following values:
READS, 0
READ_KB, 0
WRITES, 0
WRITE_KB, 0
CPU_TIME_MS, 0
ROWS_SCANNED, 0
ROWS_RETURNED, 0
Here’s Jeffrey’s second query, where an acceptable amount of prefetching is taking place:
select [Internet Sales Amount] on 0,
head(descendants([Date].[Calendar].[Calendar Year].&[2003],[Date].[Calendar].[Date]), 32) on 1
from [Adventure Works]
On a cold cache this is what I get from Resource Usage, showing slightly more activity going on:
READS, 16
READ_KB, 738
WRITES, 0
WRITE_KB, 0
CPU_TIME_MS, 15
ROWS_SCANNED, 36932
ROWS_RETURNED, 693
If we now look at Jeffrey’s third query, where he shows a scenario where excessive prefetching is taking place:
select [Internet Sales Amount] on 0,
head(descendants([Date].[Calendar].[Calendar Year].&[2003],[Date].[Calendar].[Date]), 33) on 1
from [Adventure Works]
Here’s what I get on a cold cache from Resource Usage:
READS, 32
READ_KB, 1889
WRITES, 0
WRITE_KB, 0
CPU_TIME_MS, 46
ROWS_SCANNED, 74655
ROWS_RETURNED, 63831
It’s clear from these numbers that a lot more work is going on in the Storage Engine compared to the previous two queries, although I’m not sure it’s worth trying to read too much into what the exact values themselves actually represent (unless of course you happen to be Jeffrey). I think it’s also going to be dangerous to make simplistic general recommendations about these values: while in some cases trying to keep the values returned as low as possible will be a good idea, I’m pretty sure there are going to be other situations where a more efficient query would involve more reads from disk, or scanning or returning more rows, than a less efficient version of the same query would. That said, this is useful and interesting information and another weapon in the arsenal of the SSAS consultant out in the field trying to diagnose why a query is slow and what can be done to tune it.
 |
Chris has been working with Microsoft BI tools since he started using beta 3 of OLAP Services back in the late 90s. Since then he has worked with Analysis Services in a number of roles (including three years spent with Microsoft Consulting Services) and he is now an independent consultant specialising in complex MDX, Analysis Services cube design and Analysis Services query performance problems. His company website can be found at http://www.crossjoin.co.uk and his blog can be found at http://cwebbbi.wordpress.com . |
Tags: management, performance


