How to use MDW to collect Analysis Services 2008 performance counters
In one of my previous blog posts I described SQL Server 2008 Management Data Warehouse (MDW) and how it can be used to collect performance information. This post will describe how you can create new MDW data collection sets to capture SQL Server Analysis Services (SSAS) 2008 performance counters.
SQL Server 2008 does not have a graphical interface to create MDW data collection sets, so the best way to do that is by scripting an existing system data collection set and then changing it. To script an existing data collector, start SQL Server Management Studio, expand “Management”->”Data Collection”->”System Data Collection Sets” folder then right mouse click-> “Script Data Collection As..”->”Create To”->”New Query Editor Window”. For my starting point I scripted the data collection set ”Server Activity” and got this script.
The original script collects information from two different collector types: “Generic T-SQL Query Collector Type” and “Performance Counters Collector Type”. For this exercise I removed part of the script related to the first collector type. Then I updated the data collection set name and replaced the performance counters that I am interested in collecting. All performance counters are listed in the string as XML node attributes. Here is example of one counter:
<PerformanceCounters Objects=”Process” Counters=”%Processor Time” Instances=”sqlservr” />
For counters you can specify value “*” and that will include all counters from a specific object. You do not have to specify the “Instances” attribute.
For this exercise I selected just a few Analysis Services related counters that I wanted to track. I see myself having at least a few SSAS related data collection sets - for example I would want to have a separate set to track cube processing performance that I would run just during nightly cube reprocessing. Here is the list of Analysis Services 2008 performance counters that you could use to build your data collection sets.
So below is the script to create a new data collection set ”Server Activity SSAS Counters 1″. This script should be executed in MDW database:
Begin Transaction
Begin Try
Declare @collection_set_id_1 int
Declare @collection_set_uid_2 uniqueidentifier
EXEC [msdb].[dbo].[sp_syscollector_create_collection_set] @name=N’Server Activity SSAS Counters 1′
, @collection_mode=0
, @description=N’Collects top-level performance indicators for the computer and the Database Engine. Enables analysis of resource use, resource bottlenecks, and Database Engine activity.’
, @logging_level=0, @days_until_expiration=14
, @schedule_name=N’CollectorSchedule_Every_15min’
, @collection_set_id=@collection_set_id_1 OUTPUT
, @collection_set_uid=@collection_set_uid_2 OUTPUT
Select @collection_set_id_1, @collection_set_uid_2
Declare @collector_type_uid_5 uniqueidentifier
Select @collector_type_uid_5 = collector_type_uid From [msdb].[dbo].[syscollector_collector_types]
Where name = N’Performance Counters Collector Type’;
Declare @collection_item_id_6 int
EXEC [msdb].[dbo].[sp_syscollector_create_collection_item] @name=N’Server Activity - SSAS Performance Counters 1′
, @parameters=N’<ns:PerformanceCountersCollector xmlns:ns=”DataCollectorType”>
<PerformanceCounters Objects=”Processor” Counters=”%Processor Time” Instances=”_Total” />
<PerformanceCounters Objects=”Process” Counters=”%Processor Time” Instances=”msmdsrv” />
<PerformanceCounters Objects=”Process” Counters=”%Processor Time” Instances=”sqlservr” />
<PerformanceCounters Objects=”MSAS 2008:Connection” Counters=”Current connections” />
<PerformanceCounters Objects=”MSAS 2008:Connection” Counters=”Current user sessions” />
<PerformanceCounters Objects=”MSAS 2008:Memory” Counters=”Memory Usage KB” />
<PerformanceCounters Objects=”MSAS 2008:Storage Engine Query” Counters=”Current measure group queries” />
<PerformanceCounters Objects=”MSAS 2008:Storage Engine Query” Counters=”Avg time/query” />
<PerformanceCounters Objects=”MSAS 2008:Storage Engine Query” Counters=”Aggregation hits/sec” />
<PerformanceCounters Objects=”MSAS 2008:Storage Engine Query” Counters=”Queries answered/sec” />
<PerformanceCounters Objects=”MSAS 2008:Storage Engine Query” Counters=”Total queries answered” />
<PerformanceCounters Objects=”MSAS 2008:MDX” Counters=”Total cells calculated” />
</ns:PerformanceCountersCollector>’
, @collection_item_id=@collection_item_id_6 OUTPUT, @frequency=60
, @collection_set_id=@collection_set_id_1, @collector_type_uid=@collector_type_uid_5
Select @collection_item_id_6Commit Transaction;
End Try
Begin Catch
Rollback Transaction;
DECLARE @ErrorMessage NVARCHAR(4000);
DECLARE @ErrorSeverity INT;
DECLARE @ErrorState INT;
DECLARE @ErrorNumber INT;
DECLARE @ErrorLine INT;
DECLARE @ErrorProcedure NVARCHAR(200);
SELECT @ErrorLine = ERROR_LINE(),
@ErrorSeverity = ERROR_SEVERITY(),
@ErrorState = ERROR_STATE(),
@ErrorNumber = ERROR_NUMBER(),
@ErrorMessage = ERROR_MESSAGE(),
@ErrorProcedure = ISNULL(ERROR_PROCEDURE(), ‘-’);
RAISERROR (14684, @ErrorSeverity, 1 , @ErrorNumber, @ErrorSeverity, @ErrorState, @ErrorProcedure, @ErrorLine, @ErrorMessage);End Catch;
GO
Here is the link to the text file with SQL statements.
After you execute this script, in SSMS you will see a new data collection set ”Server Activity SSAS Counters 1″. To begin collecting data, you will need to start this new collector (right mouse click, “Start Data Collection Set”).
After your custom data collection set is up and running, you have to build custom reports to show data that was collected. Creating custom report deserves a separate blog post or even two, as it is not very easy. The best way would be to follow the steps that Microsoft did for system MDW reports. I run the profiler to capture how Microsoft does that and found that all data for reports comes back from parameterized stored procedures. For this demo, I just quickly created a query to get the captured data and used that in the SSRS report.
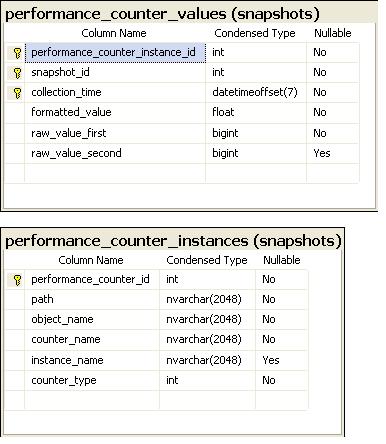
Captured performance counter data is stored in the MDW database tables snapshots.performance_counter_values and snapshots.performance_counter_instances. Here is the structure for these tables:

MDW Peformance counter related tables
Microsoft also has a view snapshots.performance_counters that is a inner join of these two tables. I used that view for my queries. Here is sample of my query:
SELECT performance_counter_id
, snapshot_id
, collection_time – UTC time used!!!
, RIGHT(LEFT(CONVERT(varchar, collection_time, 120),10),5) AS CollectionDate
, LEFT(RIGHT(CONVERT(varchar, collection_time, 120),8),5) AS CollectionTime
, path
, performance_object_name
, performance_counter_name
, performance_instance_name
, formatted_value
, raw_value_first
, raw_value_second
FROM [MDW].[snapshots].[performance_counters]
WHERE performance_object_name like ‘MSAS 2008:%’
Big surprise to me was that you cannot use BIDS 2008 to build custom reports, you have to use Reporting Services with BIDS 2005. Based on this Microsoft connect feedback it is by design, but it is quite a big inconvieniece, so I hope Microsoft will fix this in the future. If you are building custom reports for SQL Server 2008, please make sure you leave your vote for this connect feedback, as more votes should make Microsoft consider to make this change sooner.
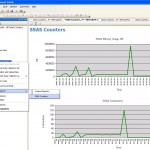
I created a sample dashboard type report just to show 2 SSAS performance counters. Here is screenshot for my dashboard:
RDL code for this report can be downloaded here. After downloading this file, please change the file extension from .txt to .rdl and copy it to your SQL Server server machine. Then in SSMS you should select the data collection set, right mouse click, then “Reports”->”Custom reports”->”Add Custom Report” and select the rdl file from the saved location. You will need to add your custom report just once, after that it will appear in the custom report list.
Please note again, that the above report is just a sample of how to build custom reports. To show captured SSAS performance counters for a real environment you will need to spend much more time in building nicer looking reports.
I like MDW because this framework provided by Microsoft takes care of data collection, storage and purge and because it is easy to integrate reports into SQL Server Management Studio. I am just waiting from Microsoft (or a third party) for a set of data collectors and reports related to Analysis Services.
Tags: performance

