Using the MDX Script Debugger in BIDS
Reposted from Chris Webb's blog with the author's permission.
Almost every time I write MDX calculations, I end up using scoped assignments – it’s by far the easiest way to control where your calculations work inside a cube. However making sure that your scoped assignments work in the places that they’re meant to work and don’t overwrite each other can be very tricky indeed (for a brief introduction to the subject and these problems, see this session I gave at SQLBits a year or so ago), so in this post I’m going to show you how you can use the MDX Script Debugger in BIDS to help you do this.
Despite its name the MDX Script Debugger doesn’t actually help you to debug individual MDX expressions or calculations. What it does is clear the MDX Script of the cube then allow you to step through each statement in the MDX Script, applying them one after the other, so you can see the cumulative effect on a query. This is only really useful when you’re working with scoped assignments because it allows you to see which cells in your query are changed with each successive assignment.
To illustrate, let’s use the Adventure Works cube. Comment out everything on the MDX Script (ie what’s on the Calculations tab) except the Calculate statement and add the following code to the bottom:
CREATE MEMBER CURRENTCUBE.MEASURES.DEMO AS 1;
SCOPE(MEASURES.DEMO);
SCOPE([Date].[Date].MEMBERS, [Date].[Calendar Quarter].[Calendar Quarter].MEMBERS);
THIS=2;
END SCOPE;
SCOPE([Date].[Calendar Year].[Calendar Year].MEMBERS);
THIS=3;
END SCOPE;
END SCOPE;
SCOPE([Measures].[Internet Sales Amount]);
SCOPE([Date].[Date].MEMBERS, [Date].[Calendar Quarter].[Calendar Quarter].MEMBERS);
THIS=2;
END SCOPE;
SCOPE([Date].[Calendar Year].[Calendar Year].MEMBERS);
THIS=3;
END SCOPE;
END SCOPE;
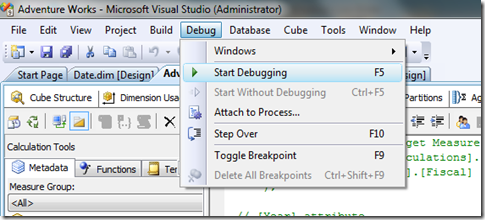
Then deploy your database and go to Debug menu in BIDS and click Start Debugging:
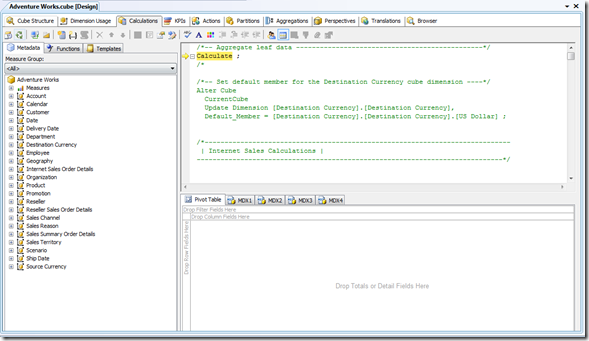
The MDX Debugger screen will then be displayed:
In the top pane you can see the Calculate statement highlighted – this is the point in the script that has been reached as you step through the code. In the bottom pane you have a browser control where you can construct a query plus four panes where you can enter your own hand-written MDX queries.
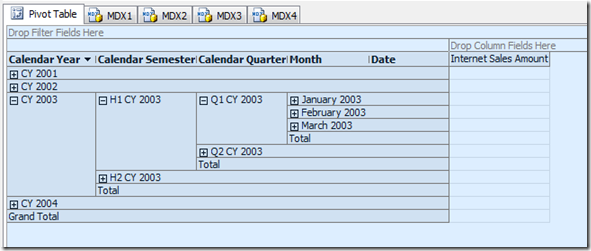
In the browser control, drag the Internet Sales Amount measure onto columns and the Calendar hierarchy from the Date dimension onto rows, until you see something like this:
You don’t see any data at the moment because the Calculate statement hasn’t been executed yet (see here for more details on what the Calculate statement does). If you hit F10 to step to the next statement in the MDX Script you’ll see the values for Internet Sales Amount appear because the Calculate statement has now been executed:
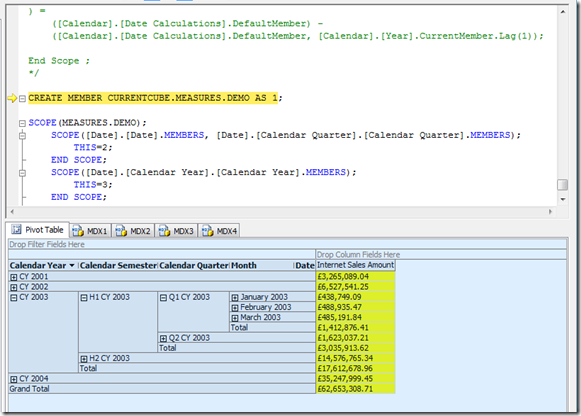
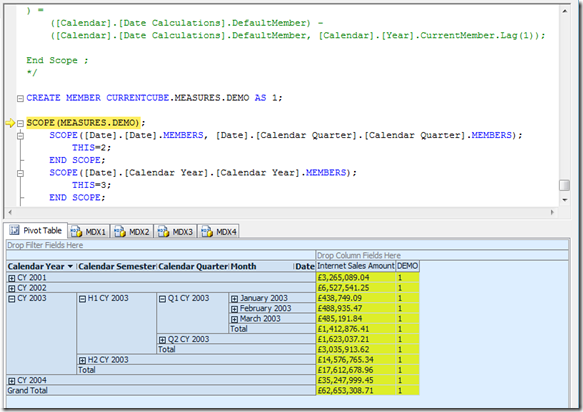
If you hit F10 again, the calculated member DEMO will be created and you can now drag it into the browser; at this point you’ll see it always returns the value 1 because none of the scoped assignments have been executed yet:
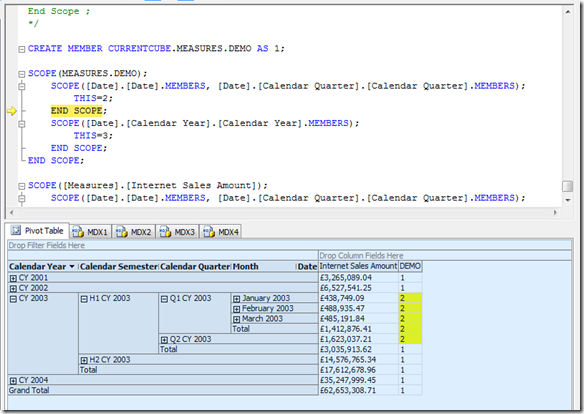
Hit F10 again until you reach the first END SCOPE statement and you’ll see the following:
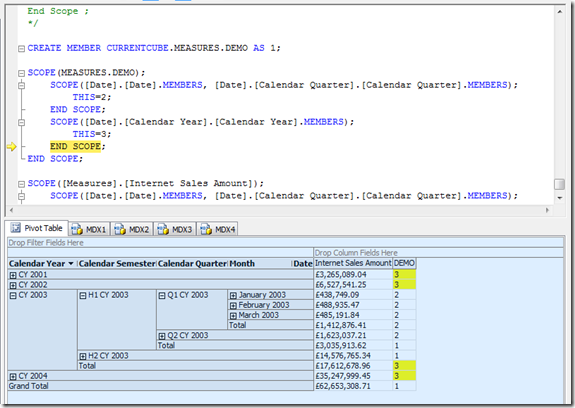
You can see that MEASURES.DEMO now returns 2 for the Date, Month and Quarter level as a result of this first assignment; you can also see that only the values that have been affected by this assignment have been changed. Hit F10 some more to execute the second assignment and you’ll see that DEMO returns 3 at the Year level and the affected cells are again highlighted:
Notice how, in this case, because you’re scoping on a calculated measure only the cells you scoped on have their values changed. This is in contrast with scoped assignments on regular measures: because regular measures aggregate up, scoping on a regular measure not only affects the values in the cells you scoped on, but those values will then also be aggregated up though the cube.
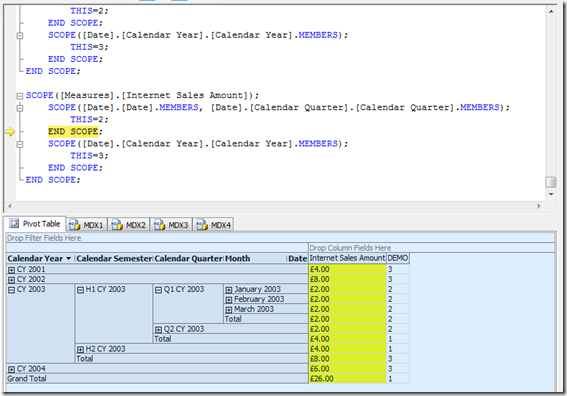
To show what does happen when you scope on a regular measure, look at the next set of scoped assignments on the Internet Sales Amount measure. The first assignment scopes on the Date, Month and Quarter levels and sets their values to 2; however the Year level values now show the aggregated totals of all the quarters in the year, so if there are four quarters in a year then the year will show 4 * 2 = 8. The All level total is also similarly affected.
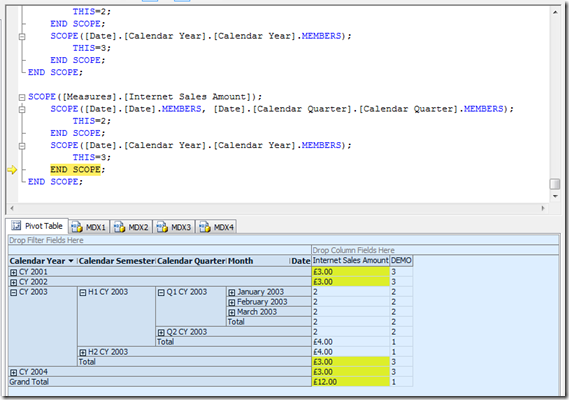
The final assignment sets the Year totals to 3 for the Year level; this overwrites the values that have been previously aggregated up from the Quarter level, and the Year level values are again aggregated up to the All level:
Hit F10 some more and you’ll reach the end of the MDX Script, whereupon you’ll go back to the beginning and can start all this again. Go to the Debug menu and click Stop Debugging to finish. Useful bit of functionality, isn’t it? Certainly one of the least-known features of BIDS too.
One last point – if you try to use the Debugger and hit the infamous SSAS Locale Identifier bug, check out Boyan Penev’s post here on how to solve this issue.
 |
Chris has been working with Microsoft BI tools since he started using beta 3 of OLAP Services back in the late 90s. Since then he has worked with Analysis Services in a number of roles (including three years spent with Microsoft Consulting Services) and he is now an independent consultant specialising in complex MDX, Analysis Services cube design and Analysis Services query performance problems. His company website can be found at http://www.crossjoin.co.uk and his blog can be found at http://cwebbbi.wordpress.com . |
Tags: mdx, performance

