Excel 2013 and BISM Multidimensional
Reposted from Thomas Ivarsson blog with the author's permission.
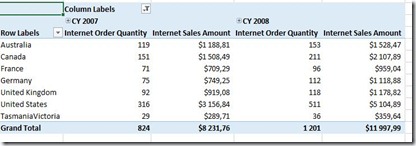
This is the first review of the new Excel 2013 BI features and I will start with the news regarding Excel 2013 as a client for SSAS cubes. In the SQL Server 2012 release SSAS has changed name to BISM Multidimensional. With this setup you cannot, yet, use the Power View report sheet that is built in to this new release of Excel. Let us hope that an update will arrive later that integrates Excel 2013 Power View reports with BISM Multidimensional.
Here is the list of new Excel 2013 features for BISM Multidimensional:
- Support for both local calculated members and calculated measures.
- The Quick Explore tool for changing the Pivot Table and Chart more quickly
- The Time Line slicer tool
- You can build Pivot Charts without an annoying Pivot Table
All this new functionality are extensions to Excel Pivot tables and Pivot Charts that you can see as the work horse for doing analysis on multidimensional cubes. I have worked with dashboard projects that relied heavily on Excel 2010 and Performance Point Services in SharePoint 2010 that was appreciated by the customers. If you know how to use slicers and charts in Excel 2010 it is very easy to build report eye candy with SSAS as the data store.
Calculated Members and Measures
In Excel 2010 we got support for local named sets that could combine members from different dimensions. For ProClarity users that was not good enough because many of them also used the calculated measures and members functionality. With Excel 2013 we finally get a client that can build all local objects that ProClarity can.
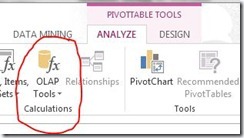
The editor for calculated measures is here under PivotTable Tools in the ribbon.
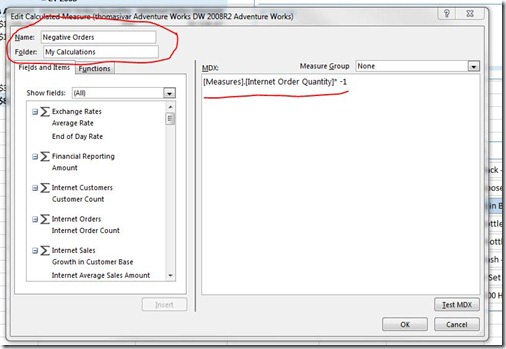
Below you see the calculated measures editor where you set the name of your clculation, the displayfolder for the calculation and the MDX expression. I have made a very simple calculation, Internet Order Quantity x -1
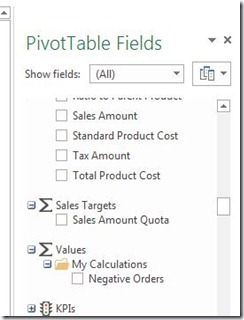
When you have saved this expression it will appear in the metadata pane to the right in the Excel dimension tool.
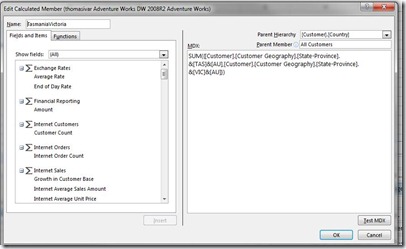
Calculated members are MDX expressions for dimension members and are also supported in Excel 2013. Here is a simple summary of two states in Australia:
SUM({[Customer].[Customer Geography].[State-Province].&[TAS]&[AU],[Customer].[Customer Geography].[State-Province].&[VIC]&[AU]})
In the picture below you can see that I have created this calculated member under the Customer.Country parent attribute.
When I drag the Customer.Country attribute to rows in the Pivot Table this new member will appear.
The Time Line Tool
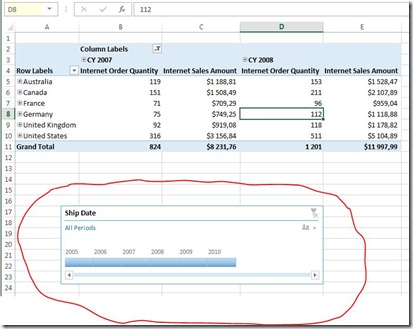
This is a new kind of slicer where you can mark continous values like years without have to use the control button to select several years in a slicer. It also have a more slim look and feel that will make you dashboards look better in Preformance Point Services.
This new tool is next to the Insert Slicer button in the Ribbon as you can see above. I have made an ugly Pivot Table with this tool in the picture below.
Pivot charts without Pivot tables
In the previous versions of Excel you will always get a Pivot Table even if you only want a Pivot Chart and that means that you will have to drag the table to an area that will not show in a dashboard.
Select the insert tab on the Ribbon and Pivot Chart. If you click that button you can now select Pivot Chart only or borth chart and table.
Quick Explore
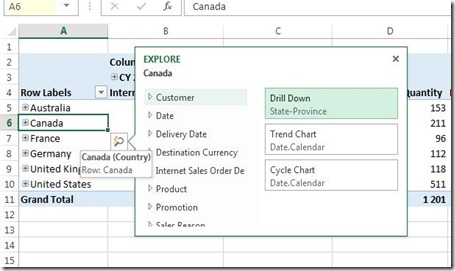
When you click in a Pivot Table on members or cells with measures you will see a small box appearing that will launch Quick Explore.
What you can do with this tool is to more quickly change dimension and members or create supporting charts. I expect that this is useful for touch screen scenarios as well.
If you double click on a hierarchy member Excel 2013 will now go down on that member and expand the next level. If you double click on Canada the Canada members on the next level will show up.
I will probably update this post as I play around more with the multidimensional support in Excel 2013. Bubble charts and Scatter charts are two desirable graphs that are not supported in Pivot Tables/Charts in Excel 2013 but they are included in the Power View part of Excel 2013. If we get multidimensional support in Excel 2013 Power View that limitation is gone.
|
|
Thomas Ivarsson has been working with the MS BI platform since SQL Server 7 in 1999. Presently he is working in the telecom industry in Sweden, with a data warehouse based on SQL Server 2005. From 1999 to 2007 he worked as a consultant also on the three SQL Server BI platforms. During the latest years he has spent most of time on SSAS, Reporting Services, ProClarity and Performance Point. He also has several years experience of the ETL process with DTS and SSIS. During 2008 and 2009 he has been working with introducing data mining in his daily business to see patterns in a service network behaviours. His blog can be found here: http://thomasivarssonmalmo.wordpress.com/ |
Tags: excel

